
Using
ADOBE
®
CONNECT
™
8


iii
Last updated 5/14/2013
Contents
Chapter 1: What’s new
Simplified interface for enhanced experiences . . . . . . . . . . . . . . . . . . . . . . . . . . . . . . . . . . . . . . . . . . . . . . . . . . . . . . . . . . . . . . . . . . . . . . . . . . 1
Adobe Connect Desktop . . . . . . . . . . . . . . . . . . . . . . . . . . . . . . . . . . . . . . . . . . . . . . . . . . . . . . . . . . . . . . . . . . . . . . . . . . . . . . . . . . . . . . . . . . . . . . . 2
A complete audio and video conferencing experience . . . . . . . . . . . . . . . . . . . . . . . . . . . . . . . . . . . . . . . . . . . . . . . . . . . . . . . . . . . . . . . . . . 2
Enterprise-class infrastructure for improved access and security . . . . . . . . . . . . . . . . . . . . . . . . . . . . . . . . . . . . . . . . . . . . . . . . . . . . . . . . 2
Expanded reach across computing platforms and devices . . . . . . . . . . . . . . . . . . . . . . . . . . . . . . . . . . . . . . . . . . . . . . . . . . . . . . . . . . . . . . 3
Extended solution capabilities via flexible, extensible architecture . . . . . . . . . . . . . . . . . . . . . . . . . . . . . . . . . . . . . . . . . . . . . . . . . . . . . . 3
Chapter 2: Adobe Connect Meeting
Adobe Connect How To topics . . . . . . . . . . . . . . . . . . . . . . . . . . . . . . . . . . . . . . . . . . . . . . . . . . . . . . . . . . . . . . . . . . . . . . . . . . . . . . . . . . . . . . . . . 4
Meeting basics . . . . . . . . . . . . . . . . . . . . . . . . . . . . . . . . . . . . . . . . . . . . . . . . . . . . . . . . . . . . . . . . . . . . . . . . . . . . . . . . . . . . . . . . . . . . . . . . . . . . . . . . 5
Accessibility features . . . . . . . . . . . . . . . . . . . . . . . . . . . . . . . . . . . . . . . . . . . . . . . . . . . . . . . . . . . . . . . . . . . . . . . . . . . . . . . . . . . . . . . . . . . . . . . . . . 7
Creating and arranging meetings . . . . . . . . . . . . . . . . . . . . . . . . . . . . . . . . . . . . . . . . . . . . . . . . . . . . . . . . . . . . . . . . . . . . . . . . . . . . . . . . . . . . . . 9
Starting and attending meetings . . . . . . . . . . . . . . . . . . . . . . . . . . . . . . . . . . . . . . . . . . . . . . . . . . . . . . . . . . . . . . . . . . . . . . . . . . . . . . . . . . . . . . 14
Updating meetings . . . . . . . . . . . . . . . . . . . . . . . . . . . . . . . . . . . . . . . . . . . . . . . . . . . . . . . . . . . . . . . . . . . . . . . . . . . . . . . . . . . . . . . . . . . . . . . . . . . 19
Viewing data about meetings . . . . . . . . . . . . . . . . . . . . . . . . . . . . . . . . . . . . . . . . . . . . . . . . . . . . . . . . . . . . . . . . . . . . . . . . . . . . . . . . . . . . . . . . . 25
Sharing content during a meeting . . . . . . . . . . . . . . . . . . . . . . . . . . . . . . . . . . . . . . . . . . . . . . . . . . . . . . . . . . . . . . . . . . . . . . . . . . . . . . . . . . . . 26
Notes, chat, Q & A, and polls . . . . . . . . . . . . . . . . . . . . . . . . . . . . . . . . . . . . . . . . . . . . . . . . . . . . . . . . . . . . . . . . . . . . . . . . . . . . . . . . . . . . . . . . . . 37
Breakout rooms . . . . . . . . . . . . . . . . . . . . . . . . . . . . . . . . . . . . . . . . . . . . . . . . . . . . . . . . . . . . . . . . . . . . . . . . . . . . . . . . . . . . . . . . . . . . . . . . . . . . . . 45
Managing attendees . . . . . . . . . . . . . . . . . . . . . . . . . . . . . . . . . . . . . . . . . . . . . . . . . . . . . . . . . . . . . . . . . . . . . . . . . . . . . . . . . . . . . . . . . . . . . . . . . 49
Chapter 3: Adobe Connect Training and Seminars
About Adobe Connect Training . . . . . . . . . . . . . . . . . . . . . . . . . . . . . . . . . . . . . . . . . . . . . . . . . . . . . . . . . . . . . . . . . . . . . . . . . . . . . . . . . . . . . . . 54
Creating training courses . . . . . . . . . . . . . . . . . . . . . . . . . . . . . . . . . . . . . . . . . . . . . . . . . . . . . . . . . . . . . . . . . . . . . . . . . . . . . . . . . . . . . . . . . . . . . 60
Creating training curriculums . . . . . . . . . . . . . . . . . . . . . . . . . . . . . . . . . . . . . . . . . . . . . . . . . . . . . . . . . . . . . . . . . . . . . . . . . . . . . . . . . . . . . . . . . 67
Creating virtual classrooms . . . . . . . . . . . . . . . . . . . . . . . . . . . . . . . . . . . . . . . . . . . . . . . . . . . . . . . . . . . . . . . . . . . . . . . . . . . . . . . . . . . . . . . . . . . 79
Monitoring training with reports . . . . . . . . . . . . . . . . . . . . . . . . . . . . . . . . . . . . . . . . . . . . . . . . . . . . . . . . . . . . . . . . . . . . . . . . . . . . . . . . . . . . . . 84
Conducting training with Adobe Connect . . . . . . . . . . . . . . . . . . . . . . . . . . . . . . . . . . . . . . . . . . . . . . . . . . . . . . . . . . . . . . . . . . . . . . . . . . . . . 91
Participating in training sessions and meetings . . . . . . . . . . . . . . . . . . . . . . . . . . . . . . . . . . . . . . . . . . . . . . . . . . . . . . . . . . . . . . . . . . . . . . . . 94
Creating and managing seminars . . . . . . . . . . . . . . . . . . . . . . . . . . . . . . . . . . . . . . . . . . . . . . . . . . . . . . . . . . . . . . . . . . . . . . . . . . . . . . . . . . . . . 96
Chapter 4: Adobe Connect Events
About Adobe Connect Events . . . . . . . . . . . . . . . . . . . . . . . . . . . . . . . . . . . . . . . . . . . . . . . . . . . . . . . . . . . . . . . . . . . . . . . . . . . . . . . . . . . . . . . . 102
Creating and editing events . . . . . . . . . . . . . . . . . . . . . . . . . . . . . . . . . . . . . . . . . . . . . . . . . . . . . . . . . . . . . . . . . . . . . . . . . . . . . . . . . . . . . . . . . 105
Managing events . . . . . . . . . . . . . . . . . . . . . . . . . . . . . . . . . . . . . . . . . . . . . . . . . . . . . . . . . . . . . . . . . . . . . . . . . . . . . . . . . . . . . . . . . . . . . . . . . . . . 119
Attending Connect Events . . . . . . . . . . . . . . . . . . . . . . . . . . . . . . . . . . . . . . . . . . . . . . . . . . . . . . . . . . . . . . . . . . . . . . . . . . . . . . . . . . . . . . . . . . . 120
Chapter 5: Audio and video conferencing
Audio in meetings . . . . . . . . . . . . . . . . . . . . . . . . . . . . . . . . . . . . . . . . . . . . . . . . . . . . . . . . . . . . . . . . . . . . . . . . . . . . . . . . . . . . . . . . . . . . . . . . . . . 122
Video in meetings . . . . . . . . . . . . . . . . . . . . . . . . . . . . . . . . . . . . . . . . . . . . . . . . . . . . . . . . . . . . . . . . . . . . . . . . . . . . . . . . . . . . . . . . . . . . . . . . . . . 131
Recording and playing back meetings . . . . . . . . . . . . . . . . . . . . . . . . . . . . . . . . . . . . . . . . . . . . . . . . . . . . . . . . . . . . . . . . . . . . . . . . . . . . . . . 133
Adobe Connect Webcast . . . . . . . . . . . . . . . . . . . . . . . . . . . . . . . . . . . . . . . . . . . . . . . . . . . . . . . . . . . . . . . . . . . . . . . . . . . . . . . . . . . . . . . . . . . . 139

iv
USING ADOBE CONNECT 8
Contents
Last updated 5/14/2013
Chapter 6: Managing content
Working with library files and folders . . . . . . . . . . . . . . . . . . . . . . . . . . . . . . . . . . . . . . . . . . . . . . . . . . . . . . . . . . . . . . . . . . . . . . . . . . . . . . . . . 141
Working with content in the Content library . . . . . . . . . . . . . . . . . . . . . . . . . . . . . . . . . . . . . . . . . . . . . . . . . . . . . . . . . . . . . . . . . . . . . . . . . . 144
Viewing data about content . . . . . . . . . . . . . . . . . . . . . . . . . . . . . . . . . . . . . . . . . . . . . . . . . . . . . . . . . . . . . . . . . . . . . . . . . . . . . . . . . . . . . . . . . 149
Chapter 7: Administering Adobe Connect
Getting started administering accounts . . . . . . . . . . . . . . . . . . . . . . . . . . . . . . . . . . . . . . . . . . . . . . . . . . . . . . . . . . . . . . . . . . . . . . . . . . . . . . 153
Connect Central How To Topics . . . . . . . . . . . . . . . . . . . . . . . . . . . . . . . . . . . . . . . . . . . . . . . . . . . . . . . . . . . . . . . . . . . . . . . . . . . . . . . . . . . . . . 167
Configure audio providers for universal voice . . . . . . . . . . . . . . . . . . . . . . . . . . . . . . . . . . . . . . . . . . . . . . . . . . . . . . . . . . . . . . . . . . . . . . . . 169
Configure video telephony devices . . . . . . . . . . . . . . . . . . . . . . . . . . . . . . . . . . . . . . . . . . . . . . . . . . . . . . . . . . . . . . . . . . . . . . . . . . . . . . . . . . 174
Change the timeout period . . . . . . . . . . . . . . . . . . . . . . . . . . . . . . . . . . . . . . . . . . . . . . . . . . . . . . . . . . . . . . . . . . . . . . . . . . . . . . . . . . . . . . . . . . 175
Creating and importing users and groups . . . . . . . . . . . . . . . . . . . . . . . . . . . . . . . . . . . . . . . . . . . . . . . . . . . . . . . . . . . . . . . . . . . . . . . . . . . . 175
Managing users and groups . . . . . . . . . . . . . . . . . . . . . . . . . . . . . . . . . . . . . . . . . . . . . . . . . . . . . . . . . . . . . . . . . . . . . . . . . . . . . . . . . . . . . . . . . 182
Setting permissions for library files and folders . . . . . . . . . . . . . . . . . . . . . . . . . . . . . . . . . . . . . . . . . . . . . . . . . . . . . . . . . . . . . . . . . . . . . . . 187
Generating reports in Connect Central . . . . . . . . . . . . . . . . . . . . . . . . . . . . . . . . . . . . . . . . . . . . . . . . . . . . . . . . . . . . . . . . . . . . . . . . . . . . . . . 195
Chapter 8: Adobe Connect Desktop
Start Adobe Connect Desktop . . . . . . . . . . . . . . . . . . . . . . . . . . . . . . . . . . . . . . . . . . . . . . . . . . . . . . . . . . . . . . . . . . . . . . . . . . . . . . . . . . . . . . . 213
Manage meeting rooms . . . . . . . . . . . . . . . . . . . . . . . . . . . . . . . . . . . . . . . . . . . . . . . . . . . . . . . . . . . . . . . . . . . . . . . . . . . . . . . . . . . . . . . . . . . . . 213
Create contact groups . . . . . . . . . . . . . . . . . . . . . . . . . . . . . . . . . . . . . . . . . . . . . . . . . . . . . . . . . . . . . . . . . . . . . . . . . . . . . . . . . . . . . . . . . . . . . . . 214
Add users to meetings or groups . . . . . . . . . . . . . . . . . . . . . . . . . . . . . . . . . . . . . . . . . . . . . . . . . . . . . . . . . . . . . . . . . . . . . . . . . . . . . . . . . . . . . 214
Find recordings in Adobe Connect Desktop . . . . . . . . . . . . . . . . . . . . . . . . . . . . . . . . . . . . . . . . . . . . . . . . . . . . . . . . . . . . . . . . . . . . . . . . . . 215

1
Last updated 5/14/2013
Chapter 1: What’s new
Simplified interface for enhanced experiences
Optimized screen use Make conducting your meetings as smooth and seamless as possible with an intuitive
interface.
Adobe Connect 8 features automatic resizing and rescaling, so you’ll never lose onscreen real estate.
Consolidated audio and visual controls let you fine-tune meeting experiences with the click of a button. (See “Inside a
meeting room” on page 5.)
Drag-and-drop for easier navigation and management Streamline managing meetings in progress and optimize
participant experiences by easily adding and moving meeting elements. Change meeting attendee roles using simple
drag-and-drop, and get more people involved by instantly granting attendees rights to video, audio, or screen-sharing
with basic mouse-over controls. (See
“Managing attendees” on page 49.)
Easily bring outside rich media directly to participants Provide participants with engaging, impactful experiences and
improve overall meeting quality by simply dragging and dropping multimedia from external sources. Bring in rich
animation, graphics, and high-quality video directly to your Adobe Connect 8 session and play them in full resolution.
(See
“Sharing content during a meeting” on page 26.)
Centralize meeting management controls Conveniently manage and display all your meeting preferences in a single
place. Manage the look of meeting backgrounds, participant options, and settings such as screen share and webcam
quality to enhance your meetings. (See
“Customize the Connect Central user interface” on page 159.)
Smart audio and visual controls Intuitive and prominent layout of audio and video controls simplifies adjusting the
sights and sounds of your meetings from a single panel. Consolidated controls for audio and visual elements let you
instantly manage how participants experience content. (See
“Audio in meetings” on page 122 and “Video in meetings”
on page 131.)
Rich notes pod and enhanced whiteboard Bring greater clarity and interactivity to your meetings with richer notes
presented in bold, italics, or underline, or formatted with multiple colors and bullets. In addition, enhanced
whiteboard features offer streamlined use and greater control over graphics. You can whiteboard on Microsoft
PowerPoint slides, JPG and PNG images, PDF documents, while screen sharing, and even on video. (See
“Taking notes
in a meeting” on page 37 and “Share a whiteboard” on page 33.)
Advanced chat With more options for public and private chat, everyone can interact in exchanges tailored to their
individual needs. Private chats are displayed in separate tabs, and you can change text color, making it easy to
differentiate and manage multiple conversations. (See
“Chat in meetings” on page 38.)
Enable greater accessibility with keyboard commands The Adobe Connect 8 interface is navigable by keyboard,
significantly improving accessibility to meetings for people with impaired motor skills vision. The interface works with
screen-readers for vision impaired to help ensure that anyone can participate in collaborative and virtual learning
sessions. (See
“Accessibility features” on page 7.)

2
USING ADOBE CONNECT 8
What’s new
Last updated 5/14/2013
Adobe Connect Desktop
Adobe Connect 8 offers Adobe Connect Desktop, an optional application based on Adobe AIR that accelerates
organizing meetings and recordings. (See
“Adobe Connect Desktop” on page 213.)
Customize attendee names (Connect 8.2) Customize the display names of attendees in the Attendees pod. Use options
under Attendees Pod preferences to add custom information to display names. Add special characters, for example
parentheses and hyphens, as delimiters between various parts of a display name.
You can also sort attendees within a group based on their customized display names. (See “Customize attendee names”
on page 50).
Intuitive meeting initiation and navigation Invite attendees and host collaborative sessions instantly without
extensive training or support from your IT department, sparing critical company resources. Launch meetings
effortlessly from your desktop, or leverage seamless integration with Microsoft Outlook, Adobe Creative Suite 5, and
other business applications. Save ongoing meetings as favorites, and store groups of participants for quick access.
Find archived recordings Searchable recording archives let you find and save meetings you missed or simply want to
review again. Archived recordings include meeting materials such as documents, charts, audio, and video that can be
played back online or offline.
Manage meetings offline Manage your meeting preferences offline and automatically update them the moment you
connect online.
A complete audio and video conferencing experience
Integrate with third-party audio- and video-conferencing systems Expand high-quality online meeting participation
by integrating dedicated video and audio conferencing systems. With Adobe Connect 8, people can participate right
from their desktops, maximizing the reach and minimizing the costs of web conferencing. (See
“Audio conferencing
options” on page 122.)
Create two-way universal voice Let Adobe Connect 8 provide a bridge for your audio, so that users can communicate
from their telephone or their computer's built-in microphone. The Universal Voice in Adobe Connect joins telephone
conferencing systems with computer-based Voice over IP. (See
“Using universal voice” on page 123.)
Enterprise-class infrastructure for improved access and
security
In-product notification (Connect 8.2) Improve the notification experience for users by letting them receive multiple
system maintenance notifications and account-based product notifications. As an administrator, you can configure
user accounts to simultaneously receive account-based notifications and system-based maintenance notifications.
When a user starts a meeting, the notifications are queued up on the Notifications panel. The user can close the
notifications if the user wants to respond later. The user can also prevent the notifications from reappearing in a
meeting. For more information, see
“Configure multiple product notifications” on page 159.
Improve meeting security and management Strengthen the security of your meetings with advanced meeting
management controls. Use optional password protection to permit only invited users to join a meeting and lead
individually controlled web sessions to mitigate the risk of unauthorized access. (See
“Invite attendees and grant or
deny access” on page 15.)

3
USING ADOBE CONNECT 8
What’s new
Last updated 5/14/2013
Optimize performance Keep meetings moving along with automatic failure prevention. Adobe Connect 8 allows
meetings to be moved seamlessly from failed or under-performing servers to high-performing servers without loss of
service.
Expanded reach across computing platforms and
devices
Integration with mobile devices
Extend the reach of your message and enhance staff productivity by letting them
attend web meetings, webinars, and eLearning sessions on the go from mobile devices. Adobe Connect 8 works on
mobile devices enabled with Adobe Flash and includes the Adobe Connect Desktop client for devices using Adobe AIR.
Support users across multiple computing environments Deliver rich content to organizations using various operating
systems and environments. With support for Windows, Mac OS, Linux, Citrix XenApp6, and other environments,
Adobe Connect 8 offers unmatched cross-platform collaboration.
Extended solution capabilities via flexible, extensible
architecture
Programming interfaces for greater extensibility Use Adobe Connect 8 published web-service application
programming interfaces (APIs) to programmatically control everything from user management and scheduling to
authentication and search. To customize web conferencing capabilities for your organization's unique requirements,
leverage the new Collaboration SDK in the Adobe Flex development environment—used by more than one million
developers worldwide.
XMPP chat integration Leverage existing investments in IM infrastructure to support XMPP-based multiuser chat in
Adobe Connect 8.

4
Last updated 5/14/2013
Chapter 2: Adobe Connect Meeting
Adobe Connect How To topics
How To topics for Hosts and Presenters
• “Create and use audio profiles” on page 125
• “Create meetings” on page 9
• “Start meetings” on page 14
• “Start meeting audio” on page 127
• “Join audio conference” on page 128
• “Record a meeting” on page 133
• “Invite attendees and grant or deny access” on page 15
• “Share your screen” on page 27
• “Share a document or PDF” on page 29
• “Share a presentation” on page 31
• “View or change an attendee’s role” on page 49
• “Taking notes in a meeting” on page 37
• “Chat in meetings” on page 38
• “Place a meeting on hold or end a meeting” on page 18
How to topics for Participants
• “Join a meeting” on page 17
• “Adjust or mute audio volume” on page 129
• “Join audio conference” on page 128
• “Broadcast your voice using VoIP” on page 129
• “Share webcam video” on page 132
• “Share your screen” on page 27
• “Chat in meetings” on page 38
• “Attending virtual classroom training” on page 95
• “Play back a recorded meeting” on page 136

5
USING ADOBE CONNECT 8
Adobe Connect Meeting
Last updated 5/14/2013
Meeting basics
About meetings
An Adobe® Connect™ Meeting is a live online conference for multiple users. The meeting room is an online application
that you use to conduct a meeting. The meeting room consists of various display panels (pods) and components. There
are several prebuilt meeting room layouts, or customize a layout to suit your needs. The meeting room enables multiple
users, or meeting attendees, to share computer screens or files, chat, broadcast live audio and video, and take part in
other interactive online activities.
Once you create a meeting room, it exists until you delete it. The meeting room location is a URL, assigned by the
system when the meeting is created. When you click the URL, you enter the virtual meeting room. A meeting room
can be used over and over for the same weekly meeting. The host can leave the meeting room open or closed between
scheduled meetings. If a meeting room is open between meetings, attendees are free to enter the room at any time to
view content.
To take part in a meeting you must have a browser, a copy of Flash® Player 10 or higher, and an Internet connection.
Your capabilities in a meeting depend on your assigned role and permissions.
More Help topics
“Creating and arranging meetings” on page 9
“Starting and attending meetings” on page 14
“Meeting room templates and layouts” on page 10
Inside a meeting room
Content in a meeting room is displayed in pods, which are panels that contain various types of media. Individual pods
contain a list of those attending the meeting, notes, chat, files, and video. A host can send attendees from the main
meeting room to breakout rooms (smaller submeetings) to collaborate as a small group.
A second display area, the Presenter Only area, is visible to hosts and presenters, not attendees. Hosts and presenters
can use the Presenter Only area to prepare content to be shared with attendees or to view confidential content.
To display the Presenter Only area, choose Meeting > Enable Presenter Only Area.
The menu bar contains several menus: a host sees the Meeting, Layouts, Pods, Audio, and Help menus; a presenter or
participant sees only the Meeting and Help menus. At the far right edge of the menu bar, the colored bar indicates the
connection status of the meeting room. Messages and warnings also appear in this corner. A red circle in the menu bar
indicates that the host is recording the meeting. The Secure Sockets Lock indicates that the meeting is connected over
a secure socket (verifying the host server’s identity)
Note: Adobe Connect administrators can change pod, sharing, and other settings to adhere to standards for governance.
These settings affect the layout of meeting rooms and what you can do in meeting rooms. For more information, see
“Working with compliance and control settings” on page 163.
Meeting options differ for different types of users:
A. Hosts B. Presenters and Participants
A
B

6
USING ADOBE CONNECT 8
Adobe Connect Meeting
Last updated 5/14/2013
More Help topics
“Work with pods” on page 16
Meeting roles and permissions
Your role determines your capabilities for sharing, broadcasting, and other activities in an Adobe Connect meeting.
There are three roles for meeting room attendees: host, presenter, and participant. Icons in the Attendees pod lets you
identify the role and if they are connecting from mobile devices.
The creator of a meeting is designated as the host by default. The host can specify each attendee’s role, including
selecting other attendees to be hosts for the meeting. Permissions for each role are as follows:
Host Hosts can set up a meeting, invite guests, add content to the library, share content, and add or edit layouts
in a meeting room. They can promote other participants to the role of meeting room host or presenter, or give
enhanced permissions to a participant without promoting the participant. Hosts can start, stop, join, and leave audio
conferences. They can also start and stop broadcasting audio into a meeting room. Hosts are able to create and manage
small group breakout rooms within a meeting. They can also perform all the tasks that a presenter or participant can.
Presenter Presenters can share content already loaded into the meeting room from the library and share
content from their computer, including Adobe® Presenter presentations (PPT or PPTX files), Flash® application files
(SWF files), images (JPEG files), Adobe PDF files, MP3 files, and FLV files. They can share their screen with all
attendees, chat, and broadcast live audio and video. Presenters can mute and unmute audio broadcasts on their
computers.
Participant (Registered) Registered participants can view the content that the presenter is sharing, hear and see
the presenter’s audio and video broadcast, and use text chat. Participants can mute and unmute audio broadcasts on
their computers.
Participant (Guest) Guest participants can view the content that the presenter is sharing, hear and see the
presenter’s audio and video broadcast, and use text chat. Participants can mute and unmute audio broadcasts on their
computers.
More Help topics
“Assign enhanced participant rights” on page 51
About the Meetings library
The Meetings tab in Adobe Connect Central contains three panes for accessing meetings: Shared Meetings, User
Meetings, and My Meetings. Each pane contains folders and files with meeting content and recordings. Users can
create and manage content in the My Meetings pane that appears when they are logged into Adobe Connect Central.
Access to content in the other panes is determined by the meeting library permissions set for each user by the Adobe
Connect Central administrator.
Content that you place in the Meetings library is available only for use in meetings. If you would like the content to be
available for other activities initiated in Adobe Connect Central (such as events, seminars, or training), upload the
content to the Content library, or move content from the Meetings library to the Content library.
More Help topics
“Working with content in the Content library” on page 144
“Content library supported file types” on page 144

7
USING ADOBE CONNECT 8
Adobe Connect Meeting
Last updated 5/14/2013
Accessibility features
An accessible document or application can be used by people with disabilities—such as mobility impairments,
blindness, and low vision. Accessibility features in Adobe Connect enable people with disabilities to use the Meeting
functionality as much as possible without a mouse.
Menu navigation
Menus at the top of the Meeting client (Application Bar menus) can be navigated to and executed entirely by keyboard.
• Press Ctrl+ Space to activate the Meeting menu.
• The left and right arrow keys activate adjacent menus on the Application Bar.
• The down arrow key activates the current menu. To select an item within the menu, use the down, up, left, and right
arrows keys.
• Enter selects the current menu item.
• Esc closes the current menu.
Navigation among pods
You can navigate among the visible pods entirely by keyboard.
• Press Ctrl+F6 (Windows) or Command+F6 (Mac OS) to navigate to the next visible pod.
• When you navigate to a pod, a colored border displays around the pod’, indicating that the pod is actively selected.
You can specify the color of the border for all meetings in an account. Click Administration > Customization >
Customize Meeting
> Button Rollover.
Certain pods have a default field that assumes focus. For example:
Chat pod Focus defaults to the new message field.
Notes pod Focus defaults to the note letting you change the message.
Attendees pod Focus defaults to the selected users in the list, or to the first user in the list if no users are selected.
When the Adobe Connect client starts, the default focus is set to the Message entry area of the visible Chat pod, if one
is available. If the Adobe Connect client loses focus (for example, if you switch to another application) and later regains
focus, the Meeting application defaults back to the Message entry area of the visible Chat pod.
Keyboard shortcuts
The following keyboard shortcuts provide improved accessibility so that the Adobe Connect Meeting client can be
used as much as possible without a mouse.
Shortcuts for attendee management
Result Windows Mac OS
Toggles Raise-Hand status Ctrl+E Command+E
Promote to host. Requires selected items in Attendees pod Ctrl+' Command+'
Demote to participant. Requires selected user in Attendees pod Ctrl+] Command+]
Promote to Presenter. Requires selected user in Attendees pod Ctrl+/ Command+/

8
USING ADOBE CONNECT 8
Adobe Connect Meeting
Last updated 5/14/2013
Shortcuts for navigating pods, menus, and windows
Shortcuts for audio and recordings
Shortcuts for presenter content in the Share pod
Shortcuts for the whiteboard
End meeting Ctrl+\ Command+\
Result Windows Mac OS
Toggle between notification window and meeting room F8 F8
Display application menu for keyboard navigation Ctrl+Space Command+F2
Move focus to next / previous pod Ctrl+F6 / Ctrl+Shift+F6 Command+F6 /
Command+Shift+F6
Display pod menu for keyboard navigation Ctrl+F8 Command+F8
Retitle pod F2 F2
Result Windows Mac OS
Toggles Microphone on or off Ctrl+M Command+M
Start/Stop Recording. For Start, brings up the Start Recording Dialog Ctrl+, Command+,
Toggles Play/Pause during playback of recorded meetings P P
Result Windows and Mac OS
Start/Stop Desktop Sharing Ctrl+[ (Windows) or Command+[ (Mac OS)
Next page/slide Page Up or Right Arrow
Previous page/slide Page Down or Left Arrow
Play/Pause P
Stop S
Mute M
Change view F
Result Windows Mac OS
Clear Ctrl+D Command+D
Print Ctrl+P Command+P
Undo Ctrl+Z Command+Z
Redo Ctrl+Y Command+Y
Delete selected items Del Delete
Move selected items in a specific direction Arrow keys Arrow keys
Result Windows Mac OS

9
USING ADOBE CONNECT 8
Adobe Connect Meeting
Last updated 5/14/2013
Shortcuts for the Chat pod
Shortcuts for the Notes pod
Shortcuts for dialog boxes
Creating and arranging meetings
Create meetings
You create meetings in Adobe Connect Central. To incorporate registration as part of your meeting, you must have
the Event Management tab. See
“About Adobe Connect Events” on page 102.
You can create meeting rooms that you return to repeatedly for your own use, and leave persistent content in the
meeting room.
1. Create an audio profile (for audio conferences)
Use the My Audio Profiles window (My Profile > My Audio Profiles) to configure an audio profile to use with an audio
conference. Audio profiles use the conference settings associated with the selected audio provider to start the audio
conference. See
“Create and use audio profiles” on page 125.
2. Start the Meeting wizard
You have two options for starting the Meeting wizard. To create the meeting in your individual My Meetings folder,
navigate to the Adobe Connect Central home page, find the Create New menu bar, and click Meeting. To create your
meeting in another folder for which you have Manage permission, navigate to that folder in the Meetings library and
click the New Meeting button.
Result Windows Mac OS
Place focus on Chat pod, activate cursor in new message
field
Ctrl+; Command+;
When cursor is in new message field, sends message Enter Return
Result Windows Mac OS
Underline text Ctrl+U Command+U
Italicize text Ctrl+I Command+I
Place text in boldface Ctrl+B Command+B
Result Windows Mac OS
Close or cancel a dialog box Esc Esc
Execute the default action (defined per dialog) Enter Return

10
USING ADOBE CONNECT 8
Adobe Connect Meeting
Last updated 5/14/2013
Two options for starting the meeting wizard
3. Enter meeting information
On the first page of the Meeting wizard, enter details about the meeting. These details include a name, custom URL,
summary, date, duration, template, language, access restrictions, and audio conference settings. (Only the name and
language are required.) If available, you can select an audio profile from the pop-up menu instead of manually entering
audio conference settings. For more information about audio profiles, see
“Create and use audio profiles” on page 125.
4. Select meeting participants
Use the Available Users And Groups list to add participants. Search for participants by name and expand groups to
select individuals in the group. If you want, assign roles by selecting participant names and clicking Permissions from
the bottom of the current participants list. Then, proceed to the final step of sending invitations or exit the wizard to
send invitations later.
5. Send invitations
The wizard guides you through two separate processes, depending on whether the meeting is open to registered users
only or to anyone. If the former, you select Send Invitations, select a group to invite (for example, hosts only), and edit
the text that appears in the e-mail. You have the option of including a Microsoft Outlook Calendar appointment. If the
latter, you click Send E-Mail Invitations, which opens your e-mail application, and add invitees to the distribution list
of your e-mail message.
More Help topics
“Edit meeting information” on page 22
“Viewing data about meetings with the dashboard” on page 25
Meeting room templates and layouts
A template is simply a meeting room that has already been designed. It can contain one or several layouts with different
display panels (or pods), configurations, and content. Layouts can be optimized for a specific task, such as presenting
slides or collaborating with peers. Leverage existing layouts and content to reduce repetitive customization each time
you create a meeting. Create your own templates or use the default templates included in Adobe Connect.
To help you quickly create a meeting room, Adobe Connect offers three built-in templates: Default Meeting, Default
Training, and Default Events. When you create a meeting by using the New Meeting wizard in Adobe Connect Central,
you simply select one of these three templates for your meeting room, add your content, and start your meeting.
When you create a meeting room from a template, the latest version of the content is added to your room. If you edit
the source file for the embedded content, the changes do not affect the content in your room. To update the content
in your meeting room, upload the revised file to the Adobe Connect server and then replace the existing content in the
meeting room with the revised content on the server.
Default Meeting template General template for meetings. It contains three layouts: Sharing, Discussion, and
Collaboration. The Sharing layout is optimized for sharing content (Microsoft PowerPoint presentations, video,

11
USING ADOBE CONNECT 8
Adobe Connect Meeting
Last updated 5/14/2013
Adobe PDF, and so on). The Discussion layout is optimized for discussing issues interactively and taking notes. The
Collaboration layout is optimized for annotating content and drawing freehand on content.
Default Meeting template layouts
A. Sharing B. Discussion C. Collaboration
Default Training template Used for online collaborative instruction and virtual classrooms. It contains three layouts:
Lobby, Classroom, and Analysis. The Lobby layout is a place to exhibit a self-running presentation or display other
preliminary content. Leave the Lobby layout open so that attendees can browse its content while waiting for the
meeting to begin. From the Classroom layout, present PowerPoint slides, share your screen, or share a whiteboard.
The Analysis layout enables you to collaborate with students, provide files to download and links to browse, and use a
whiteboard for instruction.
Default Events template Used for meetings or seminars with a large audience. It contains three layouts: Lobby,
Presentation, and Questions And Answers. The Lobby layout is a place to play music, exhibit a self-running
presentation, or display other preliminary content. Leave the Lobby layout open so that attendees can browse content
while waiting for the meeting to begin. From the Presentation layout you present PowerPoint slides, share your screen,
or show a whiteboard. The Questions And Answers layout facilitates an open Q
& A session with participants.
Information preserved in a template
A meeting room converted to a template is a duplicate of the original room. Layouts, pods, room information, and
most types of content are preserved in the template, including the following:
• Layouts with name, order, and starting (selected) status
• Pods with name, size, position, and settings for full-screen toggle
• Pod content
• Page number in PDF files and position of the seek bar in FLV files
• Whiteboard overlay contents
• Poll state (Prepare, Open, Close), questions, answers, and broadcast results
• Questions and answers, Chat pod link, and status (Open, Answered, All)
• Text in Notes pod
• Video settings
• Room on hold (Yes, No)
• Value for guest entry
• Messages displayed to users when a meeting is on hold or ended
• Room background, screen resolution, and bandwidth
• Presenter Only area status
• Contact invitees description
A
B C

12
USING ADOBE CONNECT 8
Adobe Connect Meeting
Last updated 5/14/2013
Certain information is not saved to the template. Audio conference settings, Audio Setup wizard settings, and the
content of a Chat pod are not saved to a template.
Note: Do not convert meeting rooms containing breakout rooms into templates.
Apply a template to a new meeting
1 On the Adobe Connect Central home page, in the Create New menu bar, click Meeting.
2 On the Enter Meeting Information page, next to Select Template, click the menu and make a selection. (The Shared
Templates\Default Meeting Template is the default.)
Convert a meeting room to a template
If you are a host, you can create a new meeting room template. To add a meeting room to the Shared Template folder,
you must have manager permissions for the folder. By default, you have full control over meetings and templates in
your user meeting folder.
1 From the Meetings tab in Adobe Connect Central, navigate to the meeting room you want to convert.
2 Select the checkbox next to the meeting room.
3 On the navigation bar, click Move.
Two columns are displayed in Adobe Connect Central. The name of the meeting room is displayed in the left column.
In the right column, under the heading Move to This Folder, User Meetings
> [your account] is selected by default. If
this is the folder you want to use, go to step 5.
4 Navigate to and select a template folder, such as the Shared Template folder.
5 Click Move at the bottom of the column.
Your meeting room now resides in the template folder that you selected. The template is added to the list in the
appropriate folder.
When you create a meeting with the New Meeting wizard, you can select the template you just created from the Select
Template menu. You can customize this room just like any other to meet your needs. Once the meeting is created, you
cannot apply a new template to it. Instead, you must create a new meeting by using the new template.
Create layouts
The Layouts menu and the Layout bar is visible only to hosts. The default layouts are Sharing, Discussion, and
Collaboration.
❖ To create a blank layout to which you manually add pods, or a duplicate of an existing layout that you want to
customize, do one of the following:
• Choose Layouts > Create New Layout
• Click in the Layout bar
Manage layouts
The default layouts are Sharing, Discussion, and Collaboration. You can delete, rename, or change the order of the
layouts.
Rename a layout
1 To rename a layout, choose Layouts > Manage Layouts.
2 In the Manage Layouts dialog box, select a layout.

13
USING ADOBE CONNECT 8
Adobe Connect Meeting
Last updated 5/14/2013
3 Click Rename and enter a new name.
Double-click the layout name in the Layout bar and then enter a new name.
Delete a layout
1 To delete a layout, choose Layouts > Manage Layouts.
2 In the Manage Layouts dialog box, select a layout.
3 Click Delete and confirm.
In the Layout bar, move the pointer over the layout and then click the X icon that appears to delete it.
Note: If you delete a layout that is currently in use, default Sharing layout is applied to the meeting.
Reorder layouts
1 To change the order the layouts, choose Layouts > Manage Layouts.
2 In the Manage Layouts dialog box, select a layout.
3 Click Up or Down buttons to reorder the layouts.
Drag the layout preview in the Layout bar to change the order of the layouts.
Change layouts during a meeting
The Layouts menu and the Layout bar is visible only to hosts. The default layouts are Sharing, Discussion, and
Collaboration. Any custom layouts are also listed. The Layout bar also displays thumbnails for the layouts. When a
host chooses a different layout, the new layout appears on every attendee’s screen.
❖ To change the layout, do one of the following:
• Choose Layouts > [Layout Name]
• Click a layout in the Layout bar.
Note: If all the layouts do not fit in the Layout bar, to scroll through the layouts hover the pointer over the first or the last
layout previews. You can also use the panning options or the mouse wheel to scroll through.
Adjust layouts during a meeting
During a meeting, hosts can adjust layouts without affecting the active layout currently seen by attendees.
1 Choose Meeting > Switch to Prepare Mode. Alternatively, click in the Layout bar.
2 From the Layouts menu or the Layout bar, choose the layout you want to adjust. Then move, hide, or show pods as
needed.
3 When you finish adjusting the layout, choose Meeting > End Prepare Mode or click in the Layout bar.
Choose a background image for the meeting room
You can replace the default gray background with an image.
1 Choose Meeting > Preferences.
2 Click upload, then navigate to the desired image. If you haven’t previously added the file to Connect, click Browse
My Computer.

14
USING ADOBE CONNECT 8
Adobe Connect Meeting
Last updated 5/14/2013
Reset Layouts
Reset layouts to revert to the default layouts. Any modifications to the Sharing, Discussion, and Collaboration layouts
are reverted, and custom layouts are deleted.
❖ Choose Layouts > Reset Layouts.
Note: You cannot reset layouts if a meeting is being recorded.
Specify Layout bar options
Layout bar options let you specify the docking position, and Auto hide settings. Do one of the following:
❖ From the Layout bar menu, choose one of the following:
Dock to the left Enable to dock the Layout Bar to the left edge of the meeting room window.
Dock to the right Enable to dock the Layout Bar to the right edge of the meeting room window.
Auto Hide Enable to Auto Hide the Layout Bar. Click the to pull out the Layout Bar.
Starting and attending meetings
Start meetings
When you are host, starting a meeting is as simple as logging in to your meeting room and then inviting others,
through e-mail or instant message, to do the same. Meetings can be spontaneous or prearranged.
When you have entered the meeting room, you can perform tasks to set up the meeting for attendees, such as
specifying conference information, accepting or declining requests to join the meeting, rearranging pods, and typing
in notes.
More Help topics
“Place a meeting on hold or end a meeting” on page 18
“Create and use audio profiles” on page 125
Enter a meeting room
❖ Do one of the following:
• From the Home page in Adobe Connect Central, click My Meetings, and click the Open button for the desired
meeting.
• In Adobe Connect Central, navigate to the Meeting Information page for a specific meeting and click Enter
Meeting Room.
• Click the meeting URL in the e-mail invitation that you have received. Type your Adobe Connect login and
password, and then click Enter Room.
•
Enter the meeting URL in your browser. Type your Adobe Connect login and password, and then click Enter Room.
The first time you visit a meeting room, bookmark it for quick access the next time you want to start a meeting.

15
USING ADOBE CONNECT 8
Adobe Connect Meeting
Last updated 5/14/2013
Start a meeting using the Start Meeting button
The Start Meeting button is included in software applications such as Adobe Acrobat® 8, Adobe Reader® 8, and some
Microsoft Office programs. As a meeting host, use the Start Meeting button to access your meeting room login screen
or to set up a new Adobe Connect account.
Note: In Acrobat 9 and Reader 9, you can use Adobe ConnectNow, a personal web-conference tool, for online meetings.
1 Click Start Meeting .
2 If the Welcome To Start Meeting dialog box appears, click Create Trial Account to set up a new account or click
Log In if you already have an account.
3 In the Start Meeting Log In dialog box, type your meeting URL, login, and password, and click Log In.
Note: In Acrobat 8 or Reader 8, your meeting preferences determine how much login information you have to enter before
your meeting room opens. To change your Acrobat or Reader meeting preferences, select Edit
> Preferences (Windows)
or Acrobat
> Preferences or Reader > Preferences (Mac OS), and then select Meeting on the left.
More Help topics
“Place a meeting on hold or end a meeting” on page 18
Set meeting room bandwidth
The host sets meeting room bandwidth to determine the rate (kilobits/second) at which data from the meeting is sent
to attendees. Choose a room bandwidth that matches the connection speed used by attendees. If attendees are using a
variety of connection speeds, choose the lowest speed attendees are using to ensure that all participants have a good
connection.
1 Choose Meeting > Preferences.
2 In the list on the left, select Room Bandwidth. Then select one of the following options:
LAN One presenter can generate around 250 kbits/second of data. Attendees need around 255 kbits/second. If screen
sharing is used, attendees should have 400
kbits/second.
DSL/Cable One presenter can generate around 125 kbits/second of data. Attendees need around 128 kbits/second for
a good connection. If screen sharing is used, attendees should have 200
kbits/second.
Modem One presenter can generate around 26 kbits/second of data. Attendees need around 29 kbits/second for a
good connection. Having more than one presenter with the Modem setting is not recommended. Screen sharing with
the Modem setting is not recommended.
Invite attendees and grant or deny access
While in the meeting room, hosts can invite people to attend a meeting. A host can choose to block access to a meeting,
and allow or disallow requests to enter a blocked meeting.
More Help topics
“View and modify a participant list” on page 19
Invite attendees while a meeting is in progress
Hosts can invite people to a meeting from the Adobe Connect meeting room.
1 In the menu bar, select Meeting > Manage Access And Entry > Invite Participants.

16
USING ADOBE CONNECT 8
Adobe Connect Meeting
Last updated 5/14/2013
2 In the Invite Participants dialog box, do one of the following:
• Click the Compose E-mail button to open your default e-mail application and send invitees an automatically
generated e-mail message with the meeting URL.
• Copy the meeting URL from the Invite Participants dialog box into an e-mail or instant message and send the
message to invitees. Return to the meeting room and click Cancel to close the dialog box.
Block incoming attendees
1 In the menu bar, select Meeting > Manage Access and Entry > Block Incoming Attendees.
2 To allow incoming attendees to request entry to the meeting, select Incoming Attendees Can Request Entry.
3 (Optional) In the text box, edit the message for incoming attendees. Select Save Message to save the message for
future use.
Block guests who lack registered Adobe Connect accounts
❖ In the menu bar, select Meeting > Manage Access and Entry > Block Guest Access.
Work with pods
Hosts can show and hide, add, delete, rearrange, and organize pods. More than one instance of a pod (except the
Attendees and Video pods) can be displayed in a meeting at the same time.
Note: Adobe Connect administrators can change pod, sharing, and other settings to adhere to standards for governance.
These settings affect the layout of meeting rooms and what you can do in meeting rooms. For more information, see
“Working with compliance and control settings” on page 163.
More Help topics
“Share your screen” on page 27
“Share content in the Share pod” on page 26
Show or hide a pod
• To show a pod, select it from the Pods menu. (For pods that can have multiple instances, select the instance name
from the submenu.)
A check mark appears next to the name of pods that are currently visible in the meeting.
• To hide a pod, deselect it in the Pods menu. Or click the menu icon in the upper-right corner of the pod, and
choose Hide.
Add a pod
1 In the menu bar, select Pods and select the name of a pod.
2 From the pod submenu, select New [pod name] Pod.
Move and resize pods
1 In the menu bar, select Pods > Move And Resize Pods. A check mark appears next to the option when it is selected.
2 To move a pod, drag it by its title bar. To resize a pod, drag the lower-right corner.

17
USING ADOBE CONNECT 8
Adobe Connect Meeting
Last updated 5/14/2013
Display a pod at maximum size
When you maximize a pod, it expands to fill the current browser window.
1 In the upper-right corner of the pod, click the menu icon , and select Maximize.
2 To restore the pod to its original size, click the menu icon again, and select Restore.
To expand the Share pod beyond the current browser window to the edge of the display, click the Full Screen button.
Organize pods
1 In the menu bar, select Pods > Manage Pods.
2 Do one of the following:
• To delete pods, select them from the list, and click Delete.
• To rename a pod, select it from the list, and click Rename.
• To locate all unused pods, click Select Unused. Any unused pods are highlighted in the list on the left. Click Delete
if you want to remove the unused pods.
3 Click Done.
Join a meeting
Attendees join a meeting as a guest or as a registered user, depending on the options chosen by the meeting host.
Before joining a meeting, check the date and time shown to determine whether it is in progress. (If the date is in the
past, the meeting appears on your meeting list under expired meetings).
If your connection to the server fails, Adobe Connect Central displays an error message and provides a link to the
Adobe Connect Central test wizard, which leads you through a series of steps to test your connection status.
1 Do one of the following:
• If you have been invited to a meeting by someone in your organization, on the Adobe Connect Home tab, click My
Meetings. In the list of meetings on the left, locate the meeting you want to join and click Enter.
• Click the URL for the meeting, most likely received in an e-mail or instant message.
2 Log in to the meeting room as either a guest or an Adobe Connect user:
• Select Enter As A Guest. Type the name to be used as your identifier in the meeting and click Enter Room.
• Select Enter With Your Login And Password. Enter your login name and password. Click Enter Room.
If you are the administrator of a hosted account, Connect displays the terms of service (ToS) by default. To log in to a
meeting, first acknowledge that you have read and agree to the ToS.
If you are a user, ToS is not displayed for hosted accounts. You can log in to a meeting before the ToS expires even if
the administrator hasn’t accepted the ToS yet.
For shared site accounts, the ToS are displayed when you first log in to Connect either as an administrator or a user.
To proceed, acknowledge that you have read and agree to the ToS. Select the check box on the screen to indicate that
you have read and agree to the ToS and Adobe Online Privacy Policy.
Note: If the administrator for your meeting has activated client-side certificates, the Select Certificate dialog box appears
when you attempt to enter a meeting, prompting you to select a certificate to verify your identity. An administrator may
have enabled a compliance Terms of Use notice that must be accepted before entering a meeting. (For more information,
see
“Working with compliance and control settings” on page 163.)

18
USING ADOBE CONNECT 8
Adobe Connect Meeting
Last updated 5/14/2013
Place a meeting on hold or end a meeting
Hosts can place participants on hold to temporarily restrict meeting room access to hosts and presenters, letting them
prepare materials. Audio conference calls are placed on hold.
Hosts can end a meeting to remove everyone, including hosts, presenters, and participants. Audio conference calls are
disconnected. If an Adobe Connect account is billed by the minute, ending a meeting prevents charges while the
meeting is not in session.
Place participants on hold
1 In the menu bar, select Meeting > Manage Access And Entry > Place Participants On Hold.
2 Revise the message to participants if you want, and click OK to place the meeting on hold.
Attendees who log in to a meeting that is on hold automatically enter when the meeting resumes.
End a meeting
1 In the menu bar, select Meeting > End Meeting.
2 Revise the message to participants if you want, and click OK to end the meeting.
Save an On Hold or End Meeting message for future use
You can write an On Hold or End Meeting message without interrupting the meeting. This allows you to write the
message during the meeting and then send it at the appropriate time.
1 In the menu bar, select Meeting > Manage Access And Entry > Place Participants On Hold.
2 Revise the message in the message box.
3 Click Save Message to save the message for future use and return to the meeting.
Restarting a meeting that is on hold or ended
❖ In the upper-right corner of the meeting room, click Start Meeting in the Participants On Hold window.
If you’ve closed that window, choose Meeting > Manage Access And Entry, and deselect Place Participants On Hold.
Working with notifications and requests
Pending requests and notifications are displayed in the menu bar. This gives you a unified view of requests and
notifications, and you can act on them. Notification and request icons display if you have pending requests.
Notifications and requests
A. User entry request B. Raise hand request C. Notifications D. Recording notification
Click a request or notification button to view details and take an action as required. Raise hand requests and access
requests are indicated separately. Other notifications are displayed under the Info button.
B
C
D
A

19
USING ADOBE CONNECT 8
Adobe Connect Meeting
Last updated 5/14/2013
Notifications under the info button
Updating meetings
After creating a meeting, you can update meeting information, change the participant list, and manage content
associated with the meeting.
Obtain information about a meeting
You can obtain details about an individual meeting at any time.
1 On the Adobe Connect Central Home tab, click My Meetings.
2 Under My Meetings, click the meeting name.
The Meeting Information page appears on the right with the following details:
Name The meeting title.
URL The web address where the meeting is to occur (the meeting room’s virtual location).
Summary A brief description of the meeting.
Start time The date and time that the meeting begins.
Duration The projected length of time of the meeting.
Language The language in which the meeting will be conducted.
Telephony information The telephone number for participants who call in to this meeting and the code that they must
enter (necessary only when the meeting is in progress).
3 From here, click the Open button next to the meeting name on the left to join the meeting.
More Help topics
“Viewing data about meetings with the dashboard” on page 25
“Meeting reports” on page 25
View and modify a participant list
If you have Manage permissions for a meeting, you can view a list of all invited attendees for each meeting room.
However, if this meeting is presented as an event, you must view and manage participants in the Event Management
tab. For more information, see
“Adobe Connect Events” on page 102.

20
USING ADOBE CONNECT 8
Adobe Connect Meeting
Last updated 5/14/2013
If you are an administrator or have Manage permissions for this meeting’s folder, you can add or remove attendees
and change an attendee’s permission setting (host, presenter, or participant).
Attendees that have been removed do not receive any notification and cannot enter the meeting unless the meeting
access setting is changed to allow entry to anyone who has the meeting URL.
More Help topics
“Workflow for creating and importing users and groups” on page 175
“Invite attendees and grant or deny access” on page 15
View a meeting participant list
1 Click the Meetings tab at the top of the Adobe Connect Central home page.
2 If necessary, navigate to the folder that contains the meeting.
3 Click the meeting name in the list.
4 In the Meeting Information page, click the Edit Participants link on the navigation bar.
Add meeting participants
1 Click the Meetings tab at the top of the Adobe Connect Central home page.
2 If necessary, navigate to the folder that contains the meeting.
3 Click the meeting name in the list.
4 In the Meeting Information page, click the Edit Participants link on the navigation bar.
5 In the Available Users And Groups list, do one of the following to select the users or groups:
• Control-click (Windows) or Command-click (Macintosh) or Shift-click to select multiple users or groups.
• To expand a group to select any individual members, double-click the group name; when you finish selecting
names, double-click Up One Level in the list to restore the original list.
• To search for a name in the list, click Search at the bottom of the window, enter the name to display it in the list,
and then select it.
6 Click Add.
7 For each new participant user or group that you added, select the appropriate permission type (Participant,
Presenter, Host, or Denied) from the Set User Role menu at the bottom of the Current Participants list.
Remove meeting participants
1 Click the Meetings tab at the top of the Adobe Connect Central home page.
2 If necessary, navigate to the folder that contains the meeting.
3 Click the meeting name in the list.
4 In the Meeting Information page, click the Edit Participants link on the navigation bar.
5 In the Current Participant list, do either of the following to select users or groups:
• Control-click (Windows) or Command-click (Macintosh) or Shift-click to select multiple users or groups.
• To search for a name in the list, click Search at the bottom of the window, enter the name to display it in the list,
and then select it.
6 Click Remove.

21
USING ADOBE CONNECT 8
Adobe Connect Meeting
Last updated 5/14/2013
Change a participant’s meeting permission
1 Click the Meetings tab at the top of the Adobe Connect Central home page.
2 If necessary, navigate to the folder that contains the meeting.
3 Click the meeting name in the list.
4 In the Meeting Information page, click the Edit Participants link on the navigation bar.
5 In the Current Participants list, do either of the following to select the users or groups whose meeting permissions
you want to change:
• Control-click (Windows) or Command-click (Macintosh) or Shift-click to select multiple users or groups.
• To search for a name in the list, click Search at the bottom of the window, enter the name to display it in the list,
and then select it.
6 For each name, select the new user role (Participant, Presenter, Host, or Denied) from the Set User Role menu at
the bottom of the Current Participants list.
View and manage meeting content
You can view uploaded content, move the content to the Content library, or delete uploaded content at any time.
More Help topics
“Working with content in the Content library” on page 144
“Share content in the Share pod” on page 26
“Sharing content during a meeting” on page 26
View a list of uploaded content
If you have Manage permissions for a meeting folder, you can view a list of all content that has been uploaded to the
server from a meeting room within that folder.
1 Click the Meetings tab at the top of the Adobe Connect Central home page.
2 If necessary, navigate to the folder that contains the meeting.
3 Click the meeting name in the list.
4 In the Meeting Information page, click the Uploaded Content link on the navigation bar.
5 A list of all uploaded content appears. From here, do any of the following:
• To see the information about a specific item in the list, click the item name.
• Move uploaded content to the Content library.
• Delete uploaded content.
• To determine if the content is still being used in the meeting room, view the Referenced column. A Yes indicates
that it is still being used. An empty column indicates that it is not.
Move uploaded content to the Content library
To move uploaded content to the Content library, you must be an administrator or a user with permissions to manage
the specific Meetings library folder that contains this meeting.
1 Click the Meetings tab at the top of the Adobe Connect Central home page.
2 If necessary, navigate to the folder that contains the meeting.

22
USING ADOBE CONNECT 8
Adobe Connect Meeting
Last updated 5/14/2013
3 Click the meeting name in the list.
4 In the Meeting Information page, click the Uploaded Content link on the navigation bar
5 Click the check box to the left of each file you want to move.
6 Click the Move To Folder button on the navigation bar.
7 Navigate to the folder location in the Content library where you want to move the content file by clicking the folder
titles or the Up One Level button.
8 Click Move.
9 Click OK.
Delete uploaded content
1 Click the Meetings tab at the top of the Adobe Connect Central home page.
2 If necessary, navigate to the folder that contains the meeting.
3 Click the meeting name in the list.
4 In the Meeting Information page, click the Uploaded Content link on the navigation bar.
5 Click the check box to the left of each file that you want to delete.
6 Click Delete.
7 Click Delete on the confirmation page to permanently delete the selected content.
Edit meeting information
If you are an administrator or a user with Manage permissions for this meeting folder, you can modify the meeting
properties on the Meeting Information page.
To edit meeting information while in the meeting room, choose Meeting > Manage Meeting Information.
1 Click the Meetings tab at the top of the Adobe Connect Central home page.
2 If necessary, navigate to the folder that contains the meeting.
3 Click the meeting name in the list.
4 In the Meeting Information page, click the Edit Information link on the navigation bar.
5 Edit any of the meeting information, such as start time or duration.
6 Click Save.
More Help topics
“Obtain information about a meeting” on page 19
“Meeting reports” on page 25
“Allocate meeting minutes to cost centers” on page 162
Options in the Edit Information page
Name A required field that appears in the meeting list, the meeting login page, and in reports.
Summary A meeting description that appears on the Meeting Information page, and is included in meeting invitations
by default. Summary length is limited to 1000 characters.

23
USING ADOBE CONNECT 8
Adobe Connect Meeting
Last updated 5/14/2013
Start time The month, day, year, and time that the meeting starts.
Note: Some Adobe Connect pricing models ignore meeting start dates and allow attendees to enter meetings before the
designated start date. Depending on the meeting pricing model your organization uses, if you change the meeting start
date to a future date, participants and presenters might still be able to enter the meeting room any time after you create
the meeting. When you are logged in to a meeting room, you can stop participants from entering the room between
meetings.
Duration The meeting length, in hours and minutes.
Language The primary language used in the meeting room.
Note: If you create a meeting in one language and later change the language on the Edit Information page, the names of
the pods in the meeting room remain in the original language. It is best to set the language when creating a meeting and
keep the language the same.
Access There are three options:
• Only registered users may enter the room (guest access is blocked) This option allows registered users and
participants to enter the room with their user name and password. Guest access is denied.
• Only registered users and accepted guests may enter the room With this option, the meeting room is accessible
only to those who have been invited as registered users, and to guests who are accepted into the meeting room by the
host.
Registered users must enter their user name and password to enter the meeting room. Accepted guests are accepted
into the room by the host. Adobe Connect can generate an individual attendance report for each registered user in the
meeting. Accepted guests are added to the total number of meeting attendees on meeting reports, but no individual
attendance report is available.
Note: For some Adobe Connect accounts, a host must be present in a meeting in order for attendees to enter.
• Users must enter room passcode Specify an alphanumeric code if you want to increase meeting security.
• Anyone who has the URL for the meeting can enter the room Anyone who receives the meeting URL. Click Send
E-mail Invitations to create an e-mail invitation in your own e-mail application. The new message contains a
prepopulated subject (Connect Invitation) and a prepopulated message (containing the meeting date, time, duration,
location, and summary) that you can edit.
Cost Center Determines how meeting room minute costs should be allocated. Use the menu to select an option and
bill costs to individual users, your cost center, or a specified cost center.
Audio Conference Settings You can choose not to include audio in the meeting, or choose from these audio
conferencing options:
• Include this audio conference with this meeting Audio profiles with preconfigured audio conference settings.
Select a profile to associate it with the meeting. Adobe Connect uses the profile to connect to the meeting room and
start the audio conference for you.
• Include other audio conference with this meeting Telephone numbers and other settings for calling into an audio
conference when the audio provider has not been configured with a dialing sequence. The settings are for display only,
for example, in the meeting invitation and meeting room. You must have an account with the provider.
Note: If you did not add audio conference settings when you initially created the meeting, you can add them during the
meeting. Ask all users to log out of the meeting while you add conference settings, and then log back into the meeting.
Update information for any items linked to this item Select this check box to update any items linked to the meeting
with the revised meeting information.

24
USING ADOBE CONNECT 8
Adobe Connect Meeting
Last updated 5/14/2013
Send meeting invitations for an existing meeting
You can send invitations for a meeting that has already been created if you are the meeting host, an administrator, or
have Manage permissions for this meeting’s folder.
A meeting invitation is an e-mail invitation informing participants of the date, time, duration, summary, URL, and
audio conference information. You can also choose to attach a Microsoft Outlook calendar event to the e-mail
message. This enables attendees to add the meeting to their Outlook calendar.
The way that invitations are sent depends on the type of meeting:
Registered guests If your meeting is for registered users only, create a custom e-mail message from within Adobe
Connect Central. Send the e-mail invitation to all hosts, participants, and presenters; presenters only; or participants
only. The subject and message body can be edited.
Anyone If your meeting is open to anyone who receives the meeting URL, click Send E-mail Invitations to create an
e-mail invitation in your own e-mail application. The new message contains a subject (the meeting name) and message
(containing the meeting date, time, duration, URL, and summary) that you can edit.
More Help topics
“Edit meeting information” on page 22
Send invitations to registered guests only
1 Click the Meetings tab at the top of the Adobe Connect Central home page.
2 If necessary, navigate to the folder that contains the meeting.
3 Click the meeting name in the list.
4 In the Meeting Information page, click the Invitations link on the navigation bar.
5 From the To menu, select the group to invite: All Hosts, Presenters, And Participants; Hosts Only; Presenters Only;
or Participants Only.
6 Edit the subject and the message body as appropriate.
7 To attach an Outlook calendar event to the e-mail, select the check box next to Attach Microsoft Outlook Calendar
Event (iCal) To E-mail Message; otherwise, clear the check box.
8 Click Send.
Send invitations to an unrestricted meeting
1 Click the Meetings tab at the top of the Adobe Connect Central home page.
2 If necessary, navigate to the folder that contains the meeting.
3 Click the meeting name in the list.
4 In the Meeting Information page, click the Invitations link on the navigation bar.
5 Do either of the following as appropriate:
• Click Send E-Mail Invitations to automatically display a new blank message in your e-mail application.
• Manually create a new e-mail message, then copy and paste the meeting URL (shown in the meeting details) into
the message.
6 Type the e-mail addresses of the invitees or add them from your address book.
7 Edit or type, as appropriate, the e-mail subject and message.
8 Send the e-mail invitation.

25
USING ADOBE CONNECT 8
Adobe Connect Meeting
Last updated 5/14/2013
Viewing data about meetings
Viewing data about meetings with the dashboard
The Meeting Dashboard provides a graphical representation of statistical data about your meetings. To see the
Dashboard, from the Home Tab click Meetings, then click Meeting Dashboard. The data, which reflects all the
meetings you have created, appears in three bar graphs; clicking in any of the bar graphs brings up the Summary
Report for the meeting.
Most Active Meetings Over Last 30 days Determined by the number of sessions.
Most Participant Meetings Over Last 30 Days Determined by the number of participants. This feature counts only
registered attendees; guest attendees are not included in the count. However, guest attendees are included in the data
reported in the Summary Report for each meeting.
Most Viewed Recordings Over Last 30 days Determined by the number of views (that is, the number of times each
archived meeting has been viewed).
The bar graphs appear within the Adobe Connect Central Meetings tab. Click Printable Version to export the
Dashboard to a browser window for printing.
More Help topics
“Obtain information about a meeting” on page 19
Meeting reports
The Reports feature of Adobe Connect Central lets you create reports that show you a given meeting from different
perspectives. To use this feature, navigate to the Meeting Information page of an individual meeting and then click the
Reports link. This displays links that let you define the following meeting information:
Summary The first report type that appears when you access the Reports feature. The Summary shows you aggregate
meeting information, which includes: name; URL For Viewing; Unique Sessions (a single instance in which a given
user has joined and exited the meeting); the last time that any invitee entered the meeting room (Most Recent Session);
number of people invited; number of those who attended; and the greatest number of people who entered the room at
any one time (Peak Users).
By Attendees Lists the name and e-mail address of each meeting participant, as well as the time they entered the
meeting and the time they left it.
By Sessions Lists the start and end time of each session, the session number, and the number of attendees. Clicking on
the session number displays the participant list for this session, including participant name and entry and exit times
for each participant.
By Questions Lists each poll by session number, number, and question. Select a view by clicking one of the following
options under the Report column:
• View answer distribution displays a pie chart in which each answer is color-coded with a unique color.
• View user responses provides an answer key that lists each answer for this poll and its corresponding answer
number; these numbers map to the pie chart. This option also shows a list of all the participants who responded in this
poll and the number of the answer they selected (if the poll question allowed multiple responses, all responses are
shown for the user).

26
USING ADOBE CONNECT 8
Adobe Connect Meeting
Last updated 5/14/2013
More Help topics
“Obtain information about a meeting” on page 19
“About Connect Central reports” on page 195
Sharing content during a meeting
Sharing a computer screen, document, or whiteboard
Hosts and presenters (and participants who have been given rights) use the Share pod to display content to attendees.
Content you can share:
• Selected items on your computer screen, including one or more open windows, one or more open applications, or
the entire desktop. See
“Share your screen” on page 27.
• A document, such as a presentation, Adobe PDF file, FLV file, a JPEG, or other file format. See “Share a document
or PDF” on page 29.
• A whiteboard with a variety of writing and drawing tools. You can share a stand-alone whiteboard, or a whiteboard
overlay that appears on top of other shared content. See
“Share a whiteboard” on page 33.
Except for PDFs, all documents shared in the Share pod can be viewed but not downloaded by attendees. To enable
attendees to download non-PDF documents, a host or presenter must instead use the File Share pod.
Installing the Connect Add-in
Presenters and hosts must install the Connect Add-in the first time they attempt to upload content or share a screen.
The Add-in is a special version of Flash Player with additional features for hosts and presenters. The Add-in provides
support for uploading files to the server and sharing screens during a meeting. It also provides additional audio
support.
Note: If you have a pop-up blocker enabled in your browser, the dialog box for downloading the Add-in will not appear.
To correct this problem, temporarily disable the pop-up blocker.
More Help topics
“Work with pods” on page 16
“Turn off display synchronization for documents” on page 31
Share content in the Share pod
The Share pod controls let hosts and presenters share content in various ways. You can maximize the pod to make
contents larger.
When you share content in the Share pod, attendees see your pointer move in the Share pod window. All activities you
perform in a shared window, application, or document are visible to attendees.
Note: Adobe Connect administrators can change pod, sharing, and other settings to adhere to standards for governance.
These settings affect the layout of meeting rooms and what you can do in meeting rooms. For more information, see
“Working with compliance and control settings” on page 163.

27
USING ADOBE CONNECT 8
Adobe Connect Meeting
Last updated 5/14/2013
More Help topics
“Work with pods” on page 16
“Share a whiteboard” on page 33
Change the content displayed in a Share pod
❖ In the upper-right corner of the Share pod, click the menu icon , and choose My Screen, Document, or
Whiteboard.
Display in Full Screen mode
❖ To display the Share pod at full screen size, click Full Screen in the upper-right corner of the pod. Click the button
again to return to normal display size.
Note: When you enable full screen mode, use Alt + Tab to go to the window that you want to share.
Display changes in the presenter’s Share pod to all participants
If you choose to display changes in the presenter’s pod to all attendees, the presenter controls the pod size for attendees.
For example, if the presenter sets the Share pod to Full Screen mode, the pod also fills the screen of attendees.
❖ In the upper-right corner of the Share pod, click menu icon , and select Force Presenter View.
Turn off sharing but keep the Share pod open
❖ Click Stop Sharing in the Share pod.
Redisplay Share pod content that was closed
❖ In the upper-right corner of the Share pod, click the menu icon . Then choose Share > Recently Shared, and
select the shared document or whiteboard from the submenu.
The submenu lists the five most recent documents. To see previously shared documents, choose Share > Document.
Use a pointer in a Share pod
When content is displayed in the Share pod, you can use a pointer to call attention to particular areas.
❖ In the upper-right corner of the Share pod, click the Pointer .
Share your screen
As a host or presenter in a meeting, you can share windows, applications, or your entire desktop. Your account
administrator can restrict the applications and processes that you can share. As a participant in a meeting, to share
your screen, a host must give you permission or promote you to a presenter or host.
When you share anything on your computer screen, actions you take in the shared region are visible to all participants
in the meeting. Participants follow the progress of your cursor as you move it across your screen.
Hosts can show their cursors without sharing their screens. Choose Meeting > Preferences, and select a Host Cursors
option.
The region or regions that you share must be visible on your desktop to be visible in the Share pod to other participants.
Overlapping windows on the desktop appear as a blue crosshatched pattern in the Share pod.

28
USING ADOBE CONNECT 8
Adobe Connect Meeting
Last updated 5/14/2013
More Help topics
“Sharing a computer screen, document, or whiteboard” on page 26
“Share a whiteboard” on page 33
“Share a document or PDF” on page 29
“Specify applications to share or block” on page 165
“Work with pods” on page 16
Optimize screen sharing quality (Host)
1 Choose Meeting > Preferences.
2 Select Quality and Frame Rate settings that optimize the tradeoff between image quality and speed.
For example, if there are large delays before attendees see changes to a shared screen, reduce the Quality setting. Or, if
smooth motion is essential to video you are sharing, increase Frame Rate.
These settings interact with the Room Bandwidth preferences. (See “Set meeting room bandwidth” on page 15.)
Share your screen (Host or Presenter)
1 Do one of the following to open a Share pod:
• Choose Layouts > Sharing.
• Choose Pods > Share > Add New Share.
2 Click the pop-up menu in the center of the Share pod, and select Share My Screen.
Note: If the Share Pod is empty, you are a participant and do not have permission to share.
3 Set “Screen sharing options” on page 28.
4 Click the Share button at the bottom of the Start Screen Sharing window to begin sharing.
Share your screen (Participant)
1 Ask a host to select your name in the Attendees pod and click Request Screen Share.
2 An alert appears on your screen that says “Begin Sharing Desktop?” Click Start.
3 Set “Screen sharing options” on page 28.
4 Click the Share button at the bottom of the Start Screen Sharing window to begin sharing.
Screen sharing options
Desktop (or Secure Desktop Sharing) Shares the contents of your desktop. If you have more than one monitor
connected to your computer, a desktop appears for each monitor. Choose the desktop that you want to share.
The Secure Desktop Sharing option appears only if the account administrator has restricted the applications and
processes that you can share. The Desktop option allows you to share authorized contents on your desktop.
Windows Shares one or more authorized windows that are open and running on your computer. Choose the window
or windows that you want to share.
Applications Shares an authorized application and all its related windows that are open and running on your
computer. Choose the application or applications that you want to share.

29
USING ADOBE CONNECT 8
Adobe Connect Meeting
Last updated 5/14/2013
Share control of your screen
While screen sharing, you can pass control of the shared desktop, window, or application to another host or presenter.
1 Start sharing your screen.
2 A host or presenter clicks Request Control on the Share pod title bar.
3 You see a request message in the upper-right corner of the meeting room window. Do one of the following:
• Click Accept to grant control of your screen.
• Click Decline to deny control of your screen.
Request control of a shared screen
Hosts and presenters can request control of the screen, but the request must be granted. Control cannot be taken
without permission.
❖ Click the Request Control button on the Share pod title bar.
If the request is accepted, a message informs you that you have been granted control of the screen. The Request Control
button becomes a Release Control button. You can now take control of the shared screen.
Release control of a shared screen
❖ Click the Release Control button on the Share pod control strip (or in the notification window) to return control
of the shared screen to the original Host or Presenter.
Change the view of a shared screen
If you’re viewing a screen shared by another presenter, you can scale the screen to fit entirely within the Share pod, or
zoom in for a clearer image.
❖ In the upper-right corner of the Share pod, choose Change View, and then select either Scale To Fit or Zoom In.
Preview your shared screen
When sharing an application, window, or desktop on your computer, you can see a preview that shows what
participants see in their Share pod.
❖ In the upper-right corner of the Share pod, click the menu icon , and select Preview Screen.
Share a document or PDF
As a host or presenter, you can share documents that have been uploaded to the Content library, or share documents
directly from your computer. Sharing documents from the Content library has the following advantages over sharing
your screen:
• Better and higher fidelity viewing experience for participants.
• Lower bandwidth requirement for presenters and participants.
• More navigation options with the Adobe Presenter sidebar.
• Preloading and organizing documents in the meeting room.
• Easier presentation when multiple presenters are involved.
If you turn off sharing, change the content in a Share pod, or close the Share pod, the document is still part of the
meeting room and can be displayed again. To edit a shared document, you must edit the source document and reload
it into the meeting.

30
USING ADOBE CONNECT 8
Adobe Connect Meeting
Last updated 5/14/2013
More Help topics
“Working with content in the Content library” on page 144
“Work with pods” on page 16
“Share a whiteboard” on page 33
PDFs in Adobe Connect
In the Content library, PDFs are stored as PDF files. When shared in a meeting room, PDFs are converted to SWF files
to enable synchronized navigation and white board capabilities.
From the Share pod, hosts and presenters can download PDFs. Participants can download PDFs if hosts and presenters
click the Sync button to turn off display synchronization.
PDF Portfolios and PDF files that are password protected cannot be converted into SWF files, preventing them from
being shared in Connect. In addition, certain PDF features are not supported when sharing PDFs in Connect. In some
cases objects within the PDF are either dropped, or only a simple image preview is displayed.
The following objects are dropped in Connect:
• Comment text (only the sticky note icon is shown)
• Attachments
• Bookmarks
• Audio clips (only the play button icon is shown)
The following objects retain a simple image preview (an image representing the object) in Connect:
• Forms
• 3D objects
• Multimedia objects (audio, video, and SWF files)
Share documents
As a host or presenter, you can share the following file types from the Content library or your computer: PPT, PPTX,
Adobe PDF, SWF, FLV, JPEG, and MP3 . The Content library is available in Adobe Connect Central.
Note: You create presentations from PowerPoint presentations using Adobe Presenter. Adobe Connect does not support
progressive-scan JPEG files.
1 Do any of the following:
• In an empty Share pod, click the pop-up menu in the center, and select Share Document.
• In the upper-right corner of the Share pod, click the menu icon , and choose Share > Document.
2 Select one of the following:
Whiteboards Displays whiteboards created for the current meeting.
Uploaded Files Displays content uploaded for the current meeting.
Click Browse My Computer to upload content for the current meeting. The document is added to the Uploaded
Content folder for the meeting in Adobe Connect Central. An administrator can move the document to the Shared
Content folder to make the document available for other meetings.
My Content Displays content in your user folder in Connect Central.

31
USING ADOBE CONNECT 8
Adobe Connect Meeting
Last updated 5/14/2013
Shared Content Displays content in Connect Central that is available to all account holders with the appropriate
permissions.
User Content Displays content in other user folders in Connect Central. To view the content in another user’s folder,
you must have View permission from that user.
3 Select the document that you want to share, and click Open.
The selected document appears in the Share pod. The document name appears in the title bar of the pod.
Turn off display synchronization for documents
By default, Adobe Connect synchronizes display of documents so that attendees see the frame that the presenter sees.
A host or presenter can use the Sync button to turn off synchronization so that attendees can move through
presentations or PDF documents at their own pace.
Note: The Sync button appears only when you have multiframe content loaded in the Share pod.
❖ With content loaded in the Share pod, click the Sync button in the lower-right corner to disable synchronization.
Controls for presentation playback appear at the bottom of the Share pod.
Share a presentation
For hosts or presenters who share a presentation in the Share pod, special controls are available for navigating and
displaying the presentation. A presentation layout has the following areas:
Presentation The main part of the window, which displays the presentation slides.
Presentation sidebar An area on the right side (default location) of the browser window that shows the name of the
presentation, the presenter information, and the Outline, Thumb, Notes, and Search tabs (if the tabs were included in
presentation theme). If you cannot see the sidebar, click Show Sidebar
to the lower-left of the presentation.
Presentation control bar A bar at the bottom of the presentation that gives you control over the presentation playback,
audio, attachments, and screen size. This is visible to hosts only, unless a host chooses to display it to participants. (To
see all presentation toolbar options, the presentation file should be loaded to the content library from Adobe Presenter.
If you load the PowerPoint PPT or PPTX file directly into the Share pod from your computer, not all presentation
toolbar options are visible. You may also need to click Sync to the lower right of the presentation.
Note: Adobe Connect administrators can change pod, sharing, and other settings to adhere to standards for governance.
These settings affect the layout of meeting rooms and what you can do in meeting rooms. For more information, see
“Working with compliance and control settings” on page 163.
More Help topics
“Working with content in the Content library” on page 144
“Work with pods” on page 16
“Share a whiteboard” on page 33
Use the presentation Outline tab
Most presentations have an Outline tab on the sidebar. The Outline tab lists the title and duration of each slide. You
can use the Outline tab to display information and to move to a specific slide in the presentation. The current slide is
highlighted with a glow color, which you can change in the theme. You can choose to display the highlight outline to
all attendees or to hosts and presenters only.
1 Click the Outline tab in the sidebar at the right.

32
USING ADOBE CONNECT 8
Adobe Connect Meeting
Last updated 5/14/2013
2 To move to a slide in the presentation, click its title in the Outline tab.
3 To show the full slide title, move the pointer over the title.
Use the Presentation Thumb tab
Presentations can have a Thumb tab on the sidebar. The Thumb tab shows a small picture of each slide, the slide title,
and the slide duration. The current slide is highlighted with a glow color, which you can change in the theme. You can
use the Thumb tab to see the contents each slide quickly and to move to a specific slide in the presentation.
Note: If you upload your presentations directly from your computer and into a meeting, the Thumb tab is not displayed.
Adobe recommends adding presentations to a meeting from the Content library.
1 Click the Thumb tab in the sidebar at the right.
2 To move to a slide, click its title in the Thumb tab.
3 To show the slide title, move the pointer over the title.
View Presentation slide notes
When creating a presentation in PowerPoint, you can enter notes for individual slides. If any slide notes exist, they can
be displayed in the presentation. Slide notes appear on the right side of the presentation window. You cannot change
the size of the slide Notes tab.
❖ Click the Notes tab in the sidebar on the right side.
The complete notes text is displayed. The text is unformatted and cannot be edited directly on the tab.
Search for text in a presentation
1 Click the Search tab in the sidebar on the right side.
2 Type the text to search for directly into the text box.
3 Click Search .
4 Search results are displayed below the text box. Click any slide title in the results list to display that slide.
Presentation toolbar options
You can control the presentation appearance and playback by using the toolbar located at the bottom of the
presentation. (To see all presentation toolbar options, the presentation file should be loaded to the Content library
from Adobe Presenter. If you load the PowerPoint PPT or PPTX file directly into the Share pod from your computer,
not all presentation toolbar options are visible. You may also need to click Sync.)
Play/Pause Pauses and resumes play of the current slide.
Back Moves to the previous slide in the presentation.
Forward Moves to the next slide in the presentation.
Slide progress bar Shows and controls the playback location within the current slide. The position marker moves as
the slide plays. You can drag the marker arrow forward or back in the current slide to change your playback location.
You can also click a specific location on the progress bar to move the slide marker position and slide playback there.
Current slide number Shows the number of the currently displayed slide and the total number of slides (for example,
2/10).
Status Shows the status of the current slide, such as Playing, Stopped, No audio, or Presentation complete.
Time Shows the current slide time and the total slide time as the slide plays (for example, 00.02/00.05).

33
USING ADOBE CONNECT 8
Adobe Connect Meeting
Last updated 5/14/2013
Audio volume Shows the volume level that is set for the slide.
Attachments Displays a small window showing any attachments (for example, documents, spreadsheets, images,
URLs) that have been added.
Show/Hide sidebar Shows or hides the sidebar.
Share a whiteboard
A host or presenter (or a participant that has been given rights) can use a whiteboard to create collaborative text,
drawings, and other annotations in a meeting.
Note: Adobe Connect administrators can change pod, sharing, and other settings to adhere to standards for governance.
These settings affect the layout of meeting rooms and what you can do in meeting rooms. For more information, see
“Working with compliance and control settings” on page 163.
More Help topics
“Work with pods” on page 16
“Share content in the Share pod” on page 26
“Share a presentation” on page 31
Create and display a whiteboard
A whiteboard allows hosts or presenters to create text, lines, circles, squares, and other freehand drawings in real time
during a meeting.
You can use a whiteboard in two different ways in a Share pod:
• A stand-alone whiteboard allows presenters to create content on a white background.
• An overlay whiteboard allows presenters to create content over an existing document in a Share pod, adding
annotations to and drawing on the document. You can lay a whiteboard over presentations, JPG, SWF, FLV, and
PDF documents.
If you turn off sharing, change the content in a Share pod, or close the Share pod, the whiteboard is still part of the
meeting room and can be displayed again.

34
USING ADOBE CONNECT 8
Adobe Connect Meeting
Last updated 5/14/2013
Whiteboard overlay
A. Show/Hide whiteboard overlay B. Pointer C. Whiteboard tools D. Whiteboard tool options E. Annotation added using the Pencil tool
Create a stand-alone whiteboard in a blank Share pod
❖ In the Share pod, choose Share My Screen > Share Whiteboard.
Add an overlay whiteboard in a Share pod
❖ With the document displayed in a Share pod, do one of the following:
• In the upper-right corner of the Share pod, click Draw. See “Whiteboard drawing tools” on page 34.
• If you are sharing an application, in the upper-right corner of the application window, click the arrow next to the
Stop Sharing button, and select Pause and Annotate.
• If you are sharing your entire desktop, click the Connect Add-in icon in the system tray (Windows) or icon bar
(Macintosh) and select Pause and Annotate.
Display an existing whiteboard
❖ Select Pods > Share > [name of whiteboard].
Navigate between multiple whiteboard pages
A stand-alone whiteboard contains multiple pages that you can move between during a presentation.
❖ In the lower-left corner of the Share pod, click the left or right arrow.
Whiteboard drawing tools
In the upper-left corner of the Share pod, the tools below are available to create text and drawings on the whiteboard.
Selection tool Selects a shape or area of the whiteboard. Click a shape to select it. Drag on the whiteboard or
content to create a selection rectangle that selects all the shapes within the rectangle. The selection rectangle has eight
control points for resizing the selected shape or shapes. Shift-drag a corner control point to maintain the aspect ratio
when you resize. Select and drag a shape to move it. To add a shape to the selection, Shift-click the shape.
A B
D
C
E

35
USING ADOBE CONNECT 8
Adobe Connect Meeting
Last updated 5/14/2013
Pencil tool Creates a free-form line. You can customize stroke color and stroke weight by using the color picker
and stroke weight pop-up menu at the lower part of the Whiteboard pod.
Highlighter tool (click Pencil to access) Creates a free-form thick marker line. You can customize stroke color and
stroke weight by using the color picker and stroke weight pop-up menu at the lower part of the Whiteboard pod.
Delete Selected Deletes items selected with the Selection tool.
Text tool Creates a floating multiline text field. You can customize fill color, font face, and font size by using the
color picker, font pop-up menu, and font size pop-up menu. Drag to create a text area where you can type.
Shapes tool Click and hold to choose from rectangles, ellipses, lines, arrows, and more. Use the options to the right
of the tool to customize appearance. Drag to expand the shape. Hold down the Shift key while dragging to create even
width and height for shapes, or snap lines every 45 degrees.
If your company has a licensed Adobe Connect account, you can use custom images for shapes. See
www.adobe.com/go/devnet_connect_stamps.
Undo Undoes the previous action. You can undo the following actions: drawing a shape, moving a shape, resizing
a shape, clearing the whiteboard, and changing a shape’s property. There is no limit to the number of times that you
can perform this operation in the pod.
Redo Repeats the previous action.
Print the contents of a whiteboard
❖ In the upper-right corner of the Share pod, click the menu icon , and select Print.
Upload and manage files using the File Share pod
Hosts and presenters can upload files to share with meeting attendees either from their computers or from the Content
library. Meeting participants cannot upload files; however, the host can change a participant’s status to allow them to
upload files. Participants who want to upload files should ask the host to change their attendee role or to grant
enhanced rights for the File Share pod.
Note: Adobe Connect administrators can change pod, sharing, and other settings to adhere to standards for governance.
These settings affect the layout of meeting rooms and what you can do in meeting rooms. For more information, see
“Working with compliance and control settings” on page 163.
More Help topics
“Working with content in the Content library” on page 144
“Share content in the Share pod” on page 26
Upload a file
1 If you do not have a File Share pod in your meeting room, click Pods > File Share > Add New File Share.
2 In the File Share pod, click Upload File, or choose that command from the pod menu .
3 Navigate to the file, and click Open.
Download a file
Meeting attendees can download files from the File Share pod to their computers.
1 In the File Share pod, select the file to download.
2 Click Save to My Computer.

36
USING ADOBE CONNECT 8
Adobe Connect Meeting
Last updated 5/14/2013
A browser window opens with the Save to My Computer dialog box. (If this window does not appear, adjust the
browser’s pop-up blocker settings.)
3 Click the Click to Download link.
4 Click Save. Navigate to the desired location, and again click Save.
5 When the downloading process is complete, click Close.
6 Close the browser window that opened in step 2.
Rename a file
This operation changes only the label that appears in the File Share pod; it doesn’t change the actual filename.
1 In the File Share pod, select the file that you want to rename.
2 In the upper-right corner of the pod, click the menu icon .
3 From the pop-up menu, select Rename Selected.
4 Type the new name, and click OK.
Remove a file
1 In the File Share pod, select the file that you want to remove.
2 In the upper-right corner of the pod, click the menu icon .
3 From the pop-up menu, select Remove Selected.
Display web pages to attendees
During meetings, hosts or presenters may want participants to view websites. You can use the Web Links pod to force
attendees’ browsers to open a designated URL. (Participants who want to add links should ask the host to change their
attendee role.)
Note: Adobe Connect administrators can change pod, sharing, and other settings to adhere to standards for governance.
These settings affect the layout of meeting rooms and what you can do in meeting rooms. For more information, see
“Working with compliance and control settings” on page 163.
More Help topics
“Work with pods” on page 16
Add a new web link
1 If you do not have a Web Links pod in your meeting room, click Pods > Web Links > Add New Web Links.
2 In the upper-right corner of the web links pod, click the menu icon .
3 Select Add Link.
4 Type the URL path, and if desired a URL name.
5 Click OK.
The full list of links appears for both hosts and participants.
Display a web page to all attendees
1 Select a link in the Web Links pod, or enter a URL in the Browse To box.

37
USING ADOBE CONNECT 8
Adobe Connect Meeting
Last updated 5/14/2013
2 Click Browse To.
On your screen and each attendee’s individual screen, the URL opens in a new instance of the web browser.
Rename a web link
1 Double-click a URL name in the Web Links pod.
2 Type the new name in the URL Name box.
3 Click OK.
Remove web links
1 Select one or more links in the Web Links pod.
2 In the upper-right corner of the web links pod, click the menu icon .
3 Select Remove Selected from the pop-up menu.
Notes, chat, Q & A, and polls
Taking notes in a meeting
Hosts and presenters use a Notes pod to take meeting notes that all attendees can see. It remains visible in a Notes pod
throughout the meeting or until a presenter edits the note or displays a different note. A host can remove the Notes
pod from view, or switch to a different room layout that does not contain that Notes pod.
When you type a message in the Notes pod of one layout, the same text appears in other layouts that contain the same
pod. With the Add New Notes option, you can create a unique instance of a Notes pod that appears in only one layout.
Hosts and presenters can use the Notes pod in several ways:
• Create a single, persistent note that is visible to attendees during the entire meeting.
• Create multiple Notes pods to display different notes.
• E-mail the contents of a Notes pod or export a text file.
Note: Adobe Connect administrators can change pod, sharing, and other settings to adhere to standards for governance.
These settings affect the layout of meeting rooms and what you can do in meeting rooms. For more information, see
“Working with compliance and control settings” on page 163.
More Help topics
“Work with pods” on page 16
“Chat in meetings” on page 38
Create a Notes pod
A host can create and display multiple Notes pods, each with its own text. You can use different Notes pods for
different layouts and meetings.
❖ From the menu bar at the top of the Stage, select Pods > Note > Add New Notes. Or, choose New Note from the
Notes pod options menu.
You can rename, move, and resize the Notes pod after it is created.

38
USING ADOBE CONNECT 8
Adobe Connect Meeting
Last updated 5/14/2013
Add a note to a Notes pod
1 As a host or presenter, click anywhere inside the Notes pod.
2 Type the text that you want to appear in the Notes pod.
Edit note text
A host, presenter, or participant with enhanced rights can edit the text in a Notes pod. (See “Assign enhanced
participant rights” on page 51.) All changes are immediately visible to attendees.
1 Click in the Notes pod to select the text that you want to edit.
2 Edit the text, or change size, style, and color using the options at the top of the pod.
Select which Notes pods to display
A host or presenter can choose which notes to display.
1 Choose Pods > Notes.
2 Select the name of the note that you want to display.
Rename a Notes pod
If you are a host, you can rename a Notes pod after creating it.
❖ Do either of the following:
• Double-click the note name in the pod and enter a new one.
• Choose Pods > Manage Pods, select the Notes pod, and click Rename.
Delete a Notes pod
1 Choose Pods > Manage Pods.
2 Select the Notes pod, and click Delete.
Export notes to a text file or e-mail
Hosts can export the contents of a Notes pod. (The Connect Add-in must be installed to use this option.)
1 Click the pod menu icon in the upper-right corner.
2 Select Export Note, and then select either Save As RTF (to create a text file) or E-mail Note.
Chat in meetings
Use the Chat pod to communicate with other attendees while a meeting is in progress. If you have a question and do
not want to disturb the meeting flow, you can send a chat message to another meeting participant. For example, when
you first enter a meeting room, you can introduce yourself by sending a chat message to everyone in the room.
As a presenter, you can use more than one Chat pod simultaneously. Chat pods can display content to either everyone
or only presenters (in the Presenter Only area).
Chat pod content is persistent, and remains in a meeting room until deleted. If you want to preserve Chat pod content
for future use, you can e-mail the content.
Note: Adobe Connect administrators can change pod, sharing, and other settings to adhere to standards for governance.
These settings affect the layout of meeting rooms and what you can do in meeting rooms. For more information, see
“Working with compliance and control settings” on page 163.
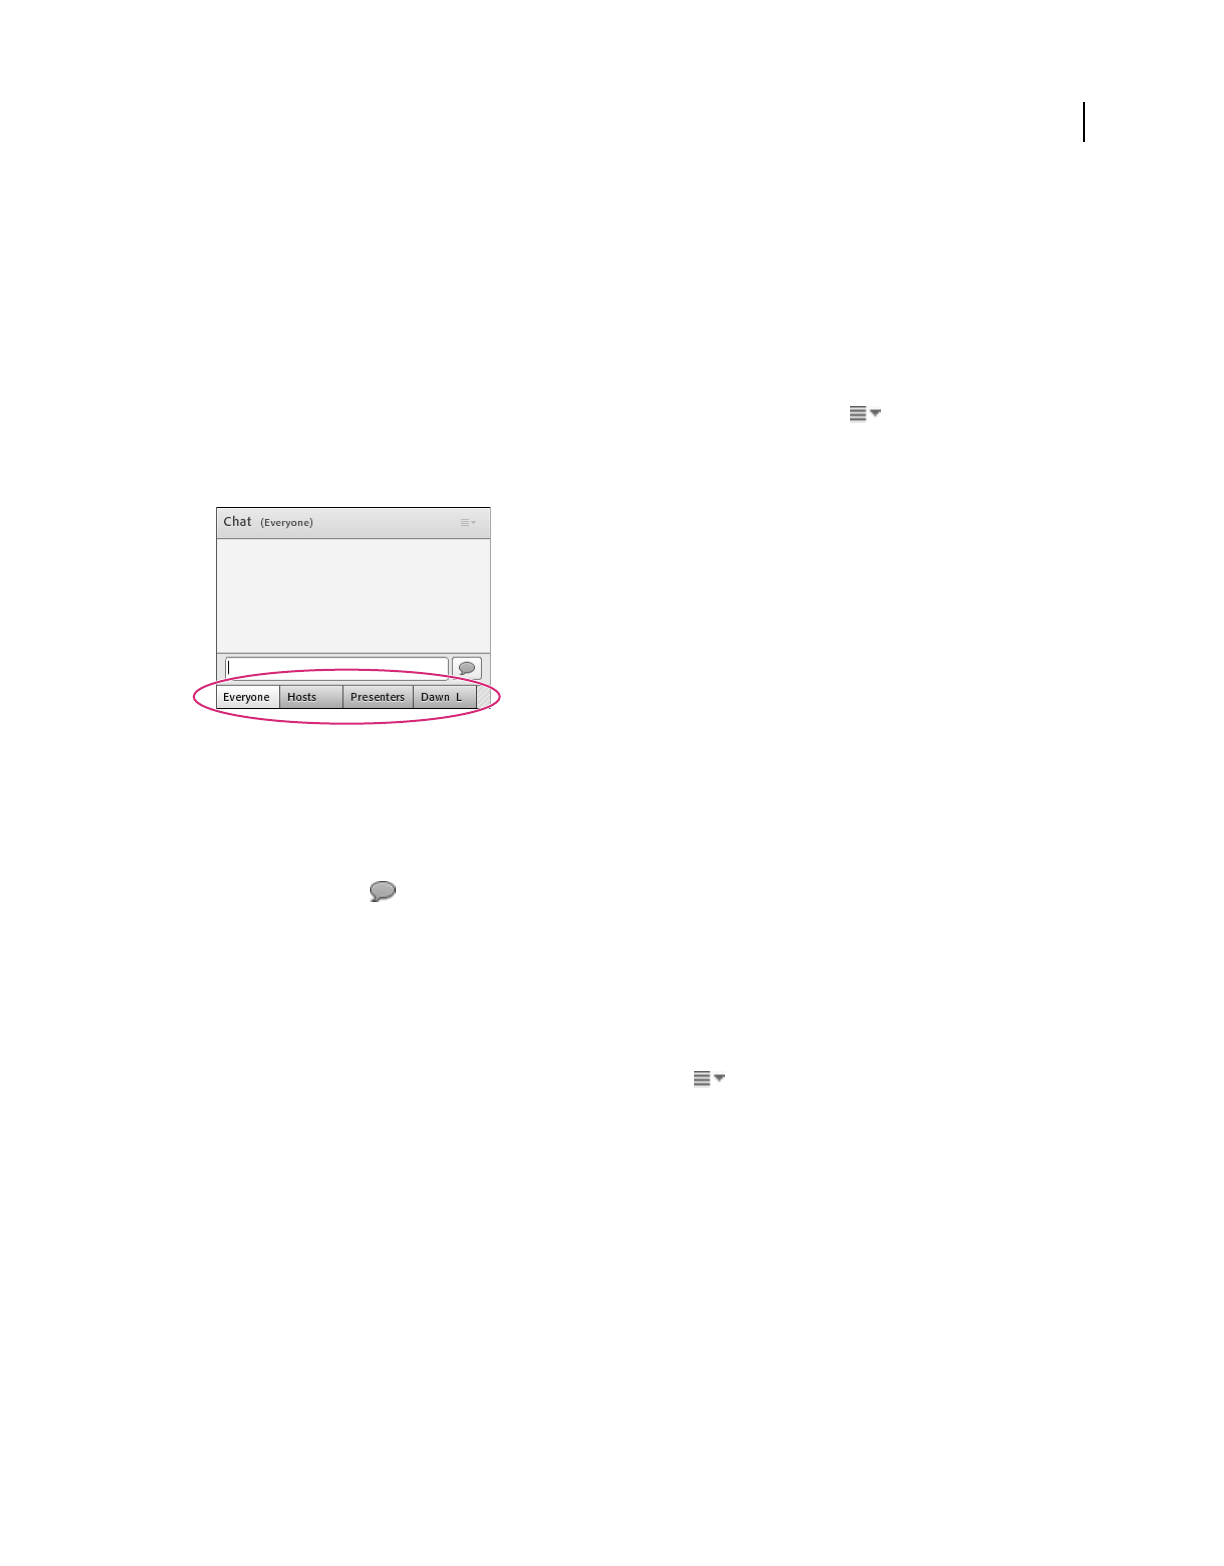
39
USING ADOBE CONNECT 8
Adobe Connect Meeting
Last updated 5/14/2013
More Help topics
“Work with pods” on page 16
“Taking notes in a meeting” on page 37
Send a chat message
Use the Chat pod to compose a chat message and address it to a specific participant, to all presenters at the meeting,
or to all attendees.
1 By default, everyone will see the message. To limit the recipients, click the menu icon in the upper-right corner
of the Chat pod. Choose Start Chat With, and then select Hosts, Presenters, or specific attendees.
At the bottom of the Chat pod, tabs appear that let you view different conversations.
At the bottom of the Chat pod, tabs let you view different conversations.
2 Click the text box in the Chat pod.
3 Enter your message.
4 Do one of the following:
• Click Send Message to the right of the text box.
• Press Enter or Return.
Your name, the addressee name, and your message appear in the Chat pod.
Clear messages from a Chat pod
When an empty Chat pod is required in a meeting, a host can clear all messages for all attendees.
1 In the upper-right corner of the Chat pod, click the menu icon .
2 Select Clear Chat.
Disable private chat between participants
By default, two participants can chat privately. As a host or presenter, you can disable this option and prevent private chat.
1 Choose Meeting > Preferences.
2 Select Chat Pod from the list on the left.
3 Deselect Enable Private Chat For Participants.

40
USING ADOBE CONNECT 8
Adobe Connect Meeting
Last updated 5/14/2013
Use chat notifications
If you are a host or presenter using the Connect Add-in, chat notifications let you communicate with your audience
while you are presenting and the meeting window is minimized or maximized to full-screen, concealing the Chat pod.
If an attendee sends you a message while you are presenting in full screen or screen sharing mode, a notification
appears in the lower-right corner of the screen. You can see the sender’s name and the first few words of the message
in the notification window. By default, chat notifications are enabled. If you don’t want notifications to be shown while
you are presenting, you can disable them.
1 Choose Meeting > Preferences.
2 Select Chat Pod from the list on the left.
3 From the pop-up menu, choose either Disable or a time duration to display each notification.
Format chat text
❖ In the upper-right corner of the Chat pod, click the menu icon , and select any of the following:
Text Size Changes size in your view only.
My Chat Color Changes your text color in the view of all participants, making your remarks stand out.
Show Timestamps For hosts only, displays the date and time of chat entries.
E-mail the contents of a Chat pod
Hosts and presenters can e-mail a chat history for future reference.
❖ In the upper-right corner of the Chat pod, click the menu icon , and select E-mail Chat History.
Questions and answers in meetings
You can use a Q & A pod to answer questions posed by attendees. When a presenter answers a question, the question
and answer appear as pairs in the Q
& A pod.
Hosts can give participants enhanced rights, letting them answer questions as well. See “Assign enhanced participant
rights” on page 51.
Here are some examples in which the Q & A pod is helpful:
• During a large meeting, questions are added to a queue on the Q & A pod while the speaker presents. After
completing the presentation, the speaker reviews the messages, applies a filter, and begins answering the questions.
• A meeting moderator answers logistical questions but forwards technical inquiries to an engineer, who is
presenting.
• A meeting moderator returns certain replies to the sender only. Replies that are relevant to all attendees are sent to
everyone in the meeting.

41
USING ADOBE CONNECT 8
Adobe Connect Meeting
Last updated 5/14/2013
Presenter View of Q&A Pod
A. Filter the list of questions B. Forward to another presenter C. Reply to the sender only D. Reply to everyone
Participant View of the Q&A pod
View the Q & A pod as participants do
By default, hosts and presenters see the Q & A pod with additional controls, but you can quickly see questions with
answers as participants do.
❖ In the upper-right corner of the Q & A pod, click either of the following:
Presenter View displays additional filtering and assignment controls visible only to hosts and presenters.
Participant View displays the simple list of questions and answers that participants see.
Move the Q&A pod presenter view to Presenter Only Area
1 In the upper-right corner of the Q & A pod, click the menu icon .
2 Choose Move Presenter View to POA.
Note: To return the Q & A pod to the Share area, in the Presenters Only Area click and choose Hide.
Submit a question in the Q & A pod
1 In the Participant View of the Q & A pod, type your question in the text box at bottom.
2 To the right of the text box, click the Send Question button , or press Return.
C
D
A
B

42
USING ADOBE CONNECT 8
Adobe Connect Meeting
Last updated 5/14/2013
Answer questions using the Q & A pod
1 Select an incoming question from the list.
2 Type your answer in the text box at the bottom of the pod.
3 Click one of the following buttons in the lower-right corner of the Q & A pod:
Answer question to everyone Sends the answer to all meeting attendees.
Answer question to submitter only Sends the answer only to the attendee who sent the question.
Answered questions appear in italics with a checkmark
Assign a question to a specific presenter
You can assign questions to presenters with specific expertise, including yourself, preventing others from answering.
1 In the Presenter View of the Q & A pod, select the question from the Incoming Messages list.
2 Select a presenter name from the Assign To pop-up menu.
Presenters can reassign questions to other presenters or choose None to cancel assignment.
Indicators for assigned questions
A. Question mark in pod title bar indicates questions are assigned to you B. Question marks in list indicate specific questions for you C. Lock
indicates questions assigned to other presenters
Show questions with different statuses
If you are a host or presenter, you can add a filter to the queue of questions in a Q & A pod so that you can see certain
questions while hiding others. You can also forward a question to another presenter to answer.
1 In the Presenter View of the Q & A pod, click the pop-up menu in the upper-left corner.
B
A
C

43
USING ADOBE CONNECT 8
Adobe Connect Meeting
Last updated 5/14/2013
2 Select one of the following:
Show All Questions Displays all questions that you have received, starting either with a new pod or from the last time
the pod was cleared.
Show Open Questions Displays all unanswered questions not assigned to anyone.
Show Answered Questions Displays all questions that have been answered.
Show My Questions Displays only unanswered questions that have been assigned to you.
Delete individual questions
You can delete questions to clean up the Presenter View. (Deleted questions and associated answers remain in the
Participant View.)
1 In the Presenter View of the Q & A pod, select a question.
2 Click Delete.
Clear all questions
To remove all content from the Presenter and Participant views, do the following:
1 In the upper-right corner of the Q & A pod, click the menu icon .
2 Select Clear All Questions.
Hide attendee names for questions
By default, attendee names appear next to submitted questions, but hosts and presenters can hide those names in
Participant View.
1 Choose Meeting > Preferences.
2 In the list at left, select Q & A pod.
3 Deselect Show Submitter Name or Show Presenter Name.
Export Q & A contents to a text file or e-mail
1 In the upper-right corner of the Q & A pod, click the menu icon .
2 Choose Export Q & A Logs, and then select either Save As RTF or E-mail Q & A.
Polling attendees
Hosts and presenters can use the Poll pod to create questions, or polls, for participants and to view the results. Only
hosts and presenters control poll management and how polls appear to meeting participants. Hosts can also cast votes.
Polls are useful during a meeting if you want instant feedback on what is being presented. Polls can also be used at the
end of a meeting to find out if participants felt the meeting, content, and presenters were high quality.
Note: Adobe Connect administrators can change pod, sharing, and other settings to adhere to standards for governance.
These settings affect the layout of meeting rooms and what you can do in meeting rooms. For more information, see
“Working with compliance and control settings” on page 163.

44
USING ADOBE CONNECT 8
Adobe Connect Meeting
Last updated 5/14/2013
More Help topics
“Work with pods” on page 16
“Chat in meetings” on page 38
“Assign enhanced participant rights” on page 51
Create a poll
1 If the Poll pod is not displayed, click the Pods menu and select Poll > Add New Poll.
2 In the upper left of the pod, choose Multiple Choice or Multiple Answers.
3 Enter a question into the Poll pod. Then enter one or more answers, and click Open.
Close the answer period for a poll
❖ At the upper right of the Poll pod, click Close. (Results are sent to the application server).
Click continue a poll, click Reopen.
Edit a poll
Note: If you edit an open poll, current results are lost.
1 Click Prepare in the upper-right corner of the Poll pod.
2 Edit the text.
3 Click Open.
View poll results
As a host or presenter, you can view poll results. These results are updated in real time as participants continue to cast
or change their votes.
1 In the upper-right corner of the Poll pod, click the menu icon .
2 Select Results Format, and choose a display option: percentages, numbers, or both.
The overall responses appear in the Poll pod. To view responses from individual participants, click View Votes.
Show poll results to participants
By default, only hosts and presenters can see poll results, but you can show them to all participants by doing the
following:
1 In the upper-right corner of the Poll pod, click the menu icon .
2 Select Broadcast Results.
Navigate among polls
You can create multiple polls and navigate among them quickly and easily.
1 In the upper-right corner of the Poll pod, click the menu icon .
2 Choose Select Poll, and select a poll name.
Clear poll answers
1 In the upper-right corner of the Poll pod, click the menu icon .

45
USING ADOBE CONNECT 8
Adobe Connect Meeting
Last updated 5/14/2013
2 Select Clear All Answers.
Breakout rooms
Breakout rooms are subrooms that can be created within a meeting or training session. They are useful for splitting a
large group into smaller groups that can talk or collaborate. Breakout rooms can be used in meetings and training
sessions that have 200 or fewer people; hosts can create up to 20 breakout rooms for a single meeting or training
session.
For example, if you have 20 people in a session, you could create 4 breakout rooms and move 5 attendees to each room.
In the breakout rooms, the attendees can speak to each other (depending on the audio configuration), use the Chat
pod, collaborate on a whiteboard, and share their screens. The host can visit all of the breakout rooms to assist and
answer questions.
When work in the breakout rooms is complete, the host can end the breakout session and return attendees to the main
room. Hosts are able to share what happened in the breakout rooms with everyone. If necessary, the host can return
attendees to their same breakout rooms. If you use the room again, you can also reuse the breakout room layout and
content. (However, the assignment of attendees to breakout rooms is not retained.)
When an audio conference is in progress, the number of breakout rooms cannot exceed the number supported by the
the audio provider. If in any of the breakout rooms the number of users exceed the maximum number supported by
the audio provider, breakout rooms cannot be started.
Note: Adobe Connect administrators can change pod, sharing, and other settings to adhere to standards for governance.
These settings affect the layout of meeting rooms and what you can do in meeting rooms. For more information, see
“Working with compliance and control settings” on page 163.
More Help topics
“Create meetings” on page 9
“Start meetings” on page 14
“Invite attendees and grant or deny access” on page 15
Audio in breakout rooms
Note: Breakout rooms in audio conferences that use universal voice do not have their own audio, just the audio from the
main meeting room. If your organization requires that all online conversations be recorded, consider using the
compliance and control settings to disable breakout rooms. See
“Working with compliance and control settings” on
page 163.
If an integrated telephony provider supports Adobe Connect breakout rooms, each breakout becomes a separate audio
conference. When breakout rooms are closed, all attendees return to the main audio conference line automatically.
When using a non-integrated provider that supports audio breakouts, manually configure your telephony breakouts
(using private audio bridges) to match the online breakout rooms.
If your provider does not support audio breakouts, instead use VoIP with computer microphones. A separate VoIP
audio channel is created for each breakout room, allowing each to have separate conversations. Participants are
automatically assigned the role of presenter in a breakout room, giving them full VoIP rights. When a host ends a
breakout session, everyone returns to the main meeting room and VoIP audio channel.

46
USING ADOBE CONNECT 8
Adobe Connect Meeting
Last updated 5/14/2013
If VoIP is not possible, attendees can use the Chat pod to communicate in breakout rooms.
About breakout room layouts
Hosts can use the default breakout room layout or design a new layout to use specifically with breakout rooms. Create
a custom breakout room layout if you want to do preparatory work before sending content and people to breakout
rooms. This can help meetings go faster and be better organized.
The layout active when you click the Start Breakouts button is reproduced in all breakout rooms. For example, if layout
1 is active and you begin breakouts with three rooms, those 3 rooms use layout 1. If you change the meeting or training
session to layout 2 and add breakout room 4, then breakout room 4 uses layout 2.
There are cases where you may want to have different layouts for different breakout rooms. For example, different
breakout rooms may contain different content or attendee exercises. In this case, create separate layouts for the
breakout rooms and ensure that the desired layout is active when you click Start Breakouts.
If you want different content in each breakout room but do not require different layouts, prepare the rooms before
attendees join the meeting or training session. First configure the number of breakout rooms required, and then click
Start Breakouts and move yourself from room to room, loading the required content into each Share pod. Then, end
the breakouts. When attendees join and you click Start Breakouts again, the content is ready. (If necessary, you can
also alter the layout and content of breakout rooms during a meeting.)
Creating and managing breakout rooms
Define breakout rooms and assign members
While in a meeting or training session, hosts can create breakout rooms and send attendees into the rooms.
1 In the Attendees pod, click the Breakout Room View button .
Note: Only the host sees the Breakout Room View of the Attendees pod.
2 In the Attendees pod, three breakout rooms are available by default; click the Create A New Breakout button
until you have the number of rooms you want (the maximum available is 20).
3 Assign attendees to breakout rooms by doing either of the following:
• Manually select an attendee name in the list (use control-click or shift-click to select multiple attendees). Then
either select a breakout room from the pop-up menu, or drag attendees to a breakout room.
• Automatically assign attendees to breakout rooms by clicking the Evenly Distribute From Main button .
(Attendees previously assigned to specific breakout rooms remain in those rooms.)
Before and after dragging attendees to different breakout rooms

47
USING ADOBE CONNECT 8
Adobe Connect Meeting
Last updated 5/14/2013
Begin a breakout session
In breakout rooms, attendees are automatically assigned the role of presenter. This gives them all presenter rights such
as sharing their voice, sharing content in the Share pod, modifying whiteboards, and adding text to the Notes pod.
When attendees are returned to the main room, they revert to their prior status.
Note: All attendees, even ones who sign in as guests, can download shared content in breakout rooms.
1 In the Attendees pod, define breakout rooms, and assign attendees to the rooms.
2 Click Start Breakouts.
Attendees are placed in the breakout rooms to which they were assigned.
Breakout room with attendees assigned as presenters
Note: If you are recording a meeting or training session and send attendees to breakout rooms, the recording continues
to record only the main room. (To edit the recording so those watching do not have to view an empty main room, see
“Edit
a recorded meeting” on page 134.)
Visiting breakout rooms
When breakout rooms are in use, hosts can visit different rooms, including the main room.
❖ To visit another room, drag your name to it in the Attendees pod.
Send a message to all attendees in breakout rooms
Hosts can broadcast messages to all breakout rooms. This can be useful if you have noticed one or more rooms have a
similar question. It is also a good practice to send attendees in breakout rooms a warning message a few minutes before
ending breakout sessions and returning them to the main room. This allows attendees to finish speaking, loading files,
and working on the whiteboard before a breakout sessions ends.
1 In the upper-right corner of the Attendees pod, click the menu icon , and choose Broadcast Message.
2 Type the message, and then click Send.
Attendees in all rooms see the message in the center of the Connect window.
Communicate attendee status in breakout rooms
Either with or without the Host present, use the options in the Attendee Status View of the Attendees pod. For
example, ask a question and ask the attendees to respond by using the status options Agree or Disagree.
For more information, see “Communicate with training or meeting attendees” on page 94.
Conduct a poll in breakout rooms
Hosts can conduct separate polls in each individual breakout room by placing themselves in the rooms and opening
Poll pods.
For general information about polling, see “Polling attendees” on page 43.

48
USING ADOBE CONNECT 8
Adobe Connect Meeting
Last updated 5/14/2013
Asking and answering questions in breakout rooms
Attendees in breakout rooms can ask hosts a question at any time, whether a host is in their breakout room or not.
• To verbally ask a host in the same breakout room a question, use the audio provided (VoIP or telephony).
• To type a question for hosts in the same breakout room, use the Chat pod menu to send a message to the host.
The host can then respond in the Chat pod to the attendee alone or everyone.
• To ask all hosts in the meeting a question, type in the Send Message To Hosts box, and then click the Send button
. The question appears to all meeting hosts in a small message box with the attendee’s name. Hosts can respond
by entering the attendee’s breakout room and using the Chat pod.
Chatting in breakout rooms
If the Chat pod is available in the breakout room, use chat to communicate with others in your room only. You cannot
chat with attendees in different breakout rooms.
For general information about using the Chat pod, see “Chat in meetings” on page 38.
End a breakout session
Only hosts can end a breakout session. When breakout rooms are closed, all attendees are returned to the main
meeting room.
❖ In the Breakout Room View of the Attendees pod, click End Breakouts.
Share breakout room content in main room
After ending a breakout session, hosts can share the contents of a single breakout room with everyone in the main room.
1 In the main room, choose Pods > Breakout Pods.
2 Select a breakout room name, and then select Chat, Share, or Whiteboard.
The selected content appears in a new floating pod. The contents are view only and cannot be changed or edited.
Reopen closed breakout rooms
After ending a breakout session, you can return attendees to the breakout rooms again. The configuration of rooms
and assigned users remains in place for the entire meeting.
1 In the Attendees pod, click the Breakout Room View button .
2 (Optional) Make changes, such as adding a room, deleting a room, or moving attendees into different rooms.
3 Click Start Breakouts.

49
USING ADOBE CONNECT 8
Adobe Connect Meeting
Last updated 5/14/2013
Remove breakout rooms
Note: In the Pods menu, pods from breakout rooms remain available until you remove them in the Attendees pod.
• To remove all rooms, click the Attendee pod menu , and choose Remove All Rooms. To store pod content,
select Save Pod Information For Future Reference, and enter a session name. (You can reaccess saved pods from
the Pods > Breakout Pods menu.)
• To remove an individual breakout room, including all pods and content it contains, click the X button to the
right of the room name. The numbering of subsequent rooms is adjusted to ensure continuity.
Managing attendees
In the Attendees pod, everyone can quickly see who is logged in to a meeting. Hosts and presenters can monitor
attendee names, roles, and statuses (such as Raised Hand or Agree).
Use the Attendee (A) and Attendee Status (B) views to monitor names, roles, and discussion status.
Note: Adobe Connect administrators can change pod, sharing, and other settings to adhere to standards for governance.
These settings affect the layout of meeting rooms and what you can do in meeting rooms. For more information, see
“Working with compliance and control settings” on page 163.
More Help topics
“Enable microphone for participants using computers” on page 128
“Participating in training sessions and meetings” on page 94
View or change an attendee’s role
A host can change the role of any attendee in the Attendees pod, promoting and demoting attendees as necessary.
More Help topics
“Meeting roles and permissions” on page 6
“Invite attendees and grant or deny access” on page 15
“Work with pods” on page 16
AB

50
USING ADOBE CONNECT 8
Adobe Connect Meeting
Last updated 5/14/2013
About attendee names
Adobe Connect users who logged in with a password appear with their full name in the Attendees pod, as it is
registered in Adobe Connect Central. If an attendee is logged in to a meeting as a guest, the name in the Attendees pod
is the name that the guest entered at login. Within a role group (hosts, presenters, and participants), attendee names
are organized alphabetically.
Customize attendee names
As a meeting host, you can customize the display name of attendees in the Attendees pod. You can include custom
information in display names, and sort attendees based on the customized display names.
To add custom information to display names:
1 In the upper-right corner of the pod, click the menu icon.
2 From the pop-up menu, select Preferences.
3 In the dialog box, select Display Name on the left pane and then select Customize format.
4 From the Available fields list, select predefined custom fields for the display name, and include them in the
Displayed fields list. The custom fields hold custom information for the attendees. You can sort attendees based on
the information in these fields. To include additional custom fields, see Add custom fields.
5 Select a custom field in the Available fields list, and then select a delimiter from the corresponding list at the bottom.
Note: The custom changes to the display name attendees reflect immediately at all places on the Connect interface,
including Chat pods and polls.
To sort attendees based on their customized display names:
1 In the Attendees pod, click the menu icon in the upper-right corner.
2 From the pop-up menu, select Preferences.
3 In the dialog box, select Attendees Pod on the left pane.
4 From the Available fields list, select custom fields to sort attendees, and include them in the Sort by list.
5 Click Done to sort attendees based on the custom fields in the order they appear in the Sort by list.
To add custom fields:
Note: You need administrator rights to modify custom fields. Modifying custom fields impacts the entire account.
1 From the Connect main menu, click Administration.
2 From the second-level menu, click Users and Groups.
3 From the next-level menu, click Customize User Profile.
4 Click Add Predefined Field to add a custom field in Connect.
Change an attendee’s role
As a host, you can demote yourself to a presenter or participant, revealing how attendees with other roles see the
meeting room.
1 In the Attendees pod, select one or more attendees. (Shift-click to select multiple.)
2 Do either of the following:.
• Drag the attendees to different roles.
• From the pop-up menu, select Make Host, Presenter, or Participant.

51
USING ADOBE CONNECT 8
Adobe Connect Meeting
Last updated 5/14/2013
Dragging attendees to different roles
Automatically promote participants to presenters
If all participants in a meeting will be presenting, do the following:
❖ Choose Meeting > Manage Access & Entry > Auto-Promote Participants to Presenters.
Assign enhanced participant rights
Hosts can change the rights of a participant to give them control over selected pods. This enhances a participant’s
rights without promoting the participant to the presenter or host role.
1 In the Attendees pod, select the name of one or more participants.
2 In the upper-right corner of the pod, click the menu icon .
3 Select Attendee Options > Enhanced Participant Rights.
4 In the dialog box, select the pods that you want the participant to control.
More Help topics
“Meeting roles and permissions” on page 6
“Work with pods” on page 16
Remove an attendee from a meeting
1 In the Attendees pod, select the attendees you want to remove.
2 In the upper-right corner of the pod, click the menu icon , and choose Remove Selected User.
More Help topics
“Invite attendees and grant or deny access” on page 15
“Work with pods” on page 16
View and change attendee status
By default, participant status is blank in the Attendees pod. However, participants can change their own status. When
a participant selects a status, an icon appears to the right of the participant’s name. Participants can clear their status
at any time during a meeting.
More Help topics
“Participating in training sessions and meetings” on page 94
“Meeting roles and permissions” on page 6

52
USING ADOBE CONNECT 8
Adobe Connect Meeting
Last updated 5/14/2013
“Invite attendees and grant or deny access” on page 15
“Work with pods” on page 16
View attendee status
❖ In the Attendees pod, do either of the following:
• To view statuses grouped by hosts, presenters, and participants, click the Attendee View button .
• To view groups of attendees who share a status (such as Disagree), click the Attendee Status View button .
Change your status (participant)
When you select the Speak Louder, Speak Softer, Speed Up, Slow Down, Laughter, and Applause statuses, the icon for
the status shows in the Attendees pod for 10 seconds. The Raise Hand, Agree, and Disagree status icons remain visible
until you or the host remove them manually. The Stepped Away status icon can only be removed by an attendee
themselves.
Attendee status Icon Duration
Raise Hand Remains displayed until attendee or host clears
Agree Remains displayed until attendee or host clears
Disagree Remains displayed until attendee or host clears
Step Away Remains displayed until attendee clears
Speak Louder 10 seconds
Speak Softer 10 seconds
Speed Up 10 seconds
Slow Down 10 seconds
Laughter 10 seconds
Applause 10 seconds

53
USING ADOBE CONNECT 8
Adobe Connect Meeting
Last updated 5/14/2013
In application bar, click triangle to right of status button to access other statuses
1 In the application bar, click the triangle to the right of the status button.
2 Select the status you want to show to all attendees.
To quickly toggle the Raised Hand status, simply click the button to the left of the menu. (If you select the Raise Hand
status and then select another status, the second status icon is displayed, but the Raised Hand remains in effect.)
Clear a participant’s status (host)
1 In the Attendees pod, select one or more participant names.
2 In the main menu, click the triangle to the right of the status button, and choose Clear Status.
Clear everyone’s status (host)
❖ From the Attendees pod menu , choose Clear Everyone’s Status.
Disable hand raising or change notification duration
1 Choose Meeting > Preferences.
2 In the list on the left, click Attendees Pod. Then do either of the following:
• Select Disable Raise Hand.
• Choose a notification duration from the pop-up menu. Select Persist In Screen Share if you want notifications to
remain visible during screen sharing until a host closes them.

54
Last updated 5/14/2013
Chapter 3: Adobe Connect Training and
Seminars
About Adobe Connect Training
About content, courses, and curriculums
Note: You can only use the Training application if this feature has been enabled for your Adobe Connect account.
The Adobe Connect Training application consists of content, courses, curriculums, and virtual classrooms.
Content is files stored in the Adobe Connect Content library. Content can be any of the following file types: PPT,
PPTX, FLV, SWF, PDF, GIF, JPG, PNG, MP3, HTML, MP4, F4V, or ZIP. With content, no individual user
information is stored. Reports are created for content, but they are aggregate, content-specific reports, and are based
on access. If content is created with Adobe Presenter and the presentation contains quizzes, you cannot set the number
of attempts users have to pass the quizzes. (In contrast, you can set number of attempts with courses.) Also, content
contains no resume functionality so, for example, if a user quits half way through a content item, the next time they
launch the item they are taken back to the beginning of the content.
A course contains any item from the Content library. A course is associated with a given set of enrolled learners and
contains no usage tracking for each individual learner. The course can be delivered and administered independently
or as part of a curriculum or virtual classroom. When you use courses, scores can be captured for AICC-compliant
objects and you can enforce the number of attempts users have to complete the course. Courses also contain resume
functionality so that users can view half a course, close the course, and then open it again later at the spot where they
left off.
A virtual classroom can be used to conduct training sessions. Virtual classrooms are added to a curriculum, just like a
course. There are three access levels for virtual classrooms: enrolled students only, enrolled students and accepted
guests, and anyone for has the URL for the virtual classroom.
A curriculum is a group of courses, meetings, and virtual classrooms that moves students along a particular learning
path. A curriculum consists primarily of courses, but can include other items such as live training sessions. With
curriculums, you can assign prerequisites, test-outs, and completion requirements to enforce a specific learning path.
As is the case with courses, you can generate reports to track the progress of the enrollees as they move through the
curriculum to ensure that they meet the learning objectives.
Training courses and curriculums have three attendance permissions: Enrolled, Denied, and Pending Approval.
Enrolled indicates a learner whom a training manager placed in a course or curriculum; Denied indicates a user who
is denied access to that course or curriculum. Usually a training manager uses the Denied permission to exclude a user
from a group course (for example, if that user already took the course). Pending Approval indicates a user waiting for
approval from the training manager.
Note: Adobe Connect administrators can change pod, sharing, and other settings to adhere to standards for governance.
These settings affect the layout of virtual classrooms and what you can do in virtual classrooms. For more information,
see
“Working with compliance and control settings” on page 163.

55
USING ADOBE CONNECT 8
Adobe Connect Training and Seminars
Last updated 5/14/2013
More Help topics
“Creating a course” on page 60
“Creating a curriculum” on page 67
“Creating a virtual classroom” on page 80
“Working with content in the Content library” on page 144
Accessing the Training library
All Adobe Connect Training courses, curriculums, and virtual classrooms are contained and organized in a directory
of folders called the Training library. You access the Training library by clicking the Training tab at the top of the
Adobe Connect Central window. As you navigate the library, the names of the folders appear as a navigation trail at
the top of the browser window.
To create courses and curriculums, you must be a training manager. To manage a Training library folder, you need
not be a training manager, but you must have Manage permissions for this folder in the Training library.
More Help topics
“Working with library files and folders” on page 141
“Working with content in the Content library” on page 144
About Training library permissions
Consider the following aspects of permissions when you work with the Training library:
Enrollee permissions define the access that learners have for a given course or curriculum. The three enrollee
permissions are: Enrolled, Denied, and Pending Approval. Individuals with an Enrolled permission can view a course
or curriculum; individuals with a Denied permission cannot access the course or curriculum. Individuals with a
Pending Approval permission need approval from the training manager.
Enrollee permissions are assigned when a course or curriculum is created. Permissions can also be changed after the
course or curriculum is created. To change permissions, the training manager must open the course or curriculum and
edit the participant list to add or remove enrollees. The training manager must also have Manage permissions for the
folder where this course or curriculum is located.
Training library management permissions define who can perform the different tasks associated with the Training
library files and folders, such as adding and deleting files, searching the library archives, and so on. The ability to create,
delete, and edit courses and curriculums in various folders in the Training library is determined by the groups that a
user belongs to and the individual permissions that are assigned to a user for specific files and folders. The Training
library has only two permissions: Manage and Denied.
Members of the Administrator group can manage all files and folders in the Training library. By default, training
managers have Manage permissions only for their individual folder in the User Training folder. This means that
training managers can add, delete, change, or assign permissions only for their own folders. All other Manage
permissions are assigned on an individual or group basis by the administrator.
Training library permissions for Built-in groups Adobe Connect recognizes six default permission groups called
Built-in groups. You cannot change the permissions for these groups, but you can extend them by assigning individuals
or groups to more than one Built-in group.
The Training module applies to the Training Managers group. This group is associated with the Training library. Each
training manager has an individual folder in the User Training folder within the Training library, in which they can

56
USING ADOBE CONNECT 8
Adobe Connect Training and Seminars
Last updated 5/14/2013
create and administer their courses and curriculums. Each training manager also has a content folder. Your Adobe
Connect administrator can also assign Manage permissions for specific Training library folders to users who are not
training managers. Only training managers can create new courses or curriculums, however.
More Help topics
“Working with library files and folders” on page 141
“Working with content in the Content library” on page 144
“Multiple permissions precedence” on page 192
Course and curriculum registration
Depending on the type and purpose of a given course or curriculum, the training manager might want to have the
guests register. If so, the manager must have the Event Management tab as part of the Adobe Connect Central
application, since registration for any training can only be done through the Event Management tab. A training
manager who has this tab must first use the Course or Curriculum wizard to create the course or curriculum from the
Training tab, but skip the select participant and send invitations steps. Next, the training manager creates an event by
opening the Event Wizard, selecting the Present A Connect Training Course Or Curriculum option, and selecting the
course or curriculum to be used as an event.
The Event wizard lets the training manager select and invite enrollees, select and customize registration questions, and
send invitations, even to large e-mail lists.
If the training is presented as an event, all enrollees, regardless of whether they have an Adobe Connect account or
whether the URL is public, must provide registration information before the training. In this case, the training
manager can review the registration applications before the training and approve or deny admittance to each
registrant.
More Help topics
“Events overview” on page 102
AICC content for courses
When you use Aviation Industry CBT Committee (AICC) content in courses, Adobe Connect applies some specific
rules. For more information, see
“Upload content” on page 145.
Viewing data about training
The Training Dashboard contains two bar graphs, one for courses and one for curriculums:
Course Summary Over the Last 30 Days Shows the courses over the last 30 days with the greatest number of enrollees
who have passed; click any bar to see more detail.
Curriculum Summary Over the Last 30 Days Shows the curriculums over the last 30 days with the greatest number of
enrollees who have completed the curriculum; click any bar to see more detail.
The bar graphs appear within Adobe Connect Central. However, you can also export the Dashboard to a browser
window that you can print. To export the Dashboard, click Printable Version on the left, above the display.

57
USING ADOBE CONNECT 8
Adobe Connect Training and Seminars
Last updated 5/14/2013
More Help topics
“Viewing data about content” on page 149
“Monitoring training with reports” on page 84
Create and manage training groups
From the Training tab in Adobe Connect Central, Training managers, Administrators, and Limited Administrators
can create, change, and remove sets of learners called training groups. Training managers can modify any training
groups, including those created by other Training managers.
Note: Training managers cannot create new users, modify information about existing users, delete users, delete groups
not created by training managers, or assign users to system groups.
More Help topics
“Manage curriculum enrollees” on page 78
“Managing users and groups” on page 182
Create a new training group
Training groups cannot be given the same name as system groups or administration groups.
1 Click the Training tab in Adobe Connect Central.
2 Click Users and Groups.
3 Click New Group.
4 Enter a name for the new group.
5 (Optional) Type in a description of the group.
6 Click Next.
7 In the Possible Group Members list, select a user or group and click Add. You can also click Search to find a user
or group that is not listed.
As you add users and groups, the Current Group Members list on the right is updated to reflect your changes.
8 When you are done, click Finish.
Add learners to an existing training group
1 Click the Training tab in Adobe Connect Central.
2 Click Users and Groups.
3 In the Users and Groups list, select the group you want to change and click Information.
4 Click View Group Members.
5 In the Possible Group Members list, select the individual or group you want to include and click Add.
Remove learners from a training group
1 Click the Training tab in Adobe Connect Central.
2 Click Users and Groups.
3 In the Users and Groups list, select the group you want to change and click Information.
4 Click View Group Members.

58
USING ADOBE CONNECT 8
Adobe Connect Training and Seminars
Last updated 5/14/2013
5 In the Current Group Members list, select the member or members you want to delete and click Remove.
Using CSV files to add learners
If you have a comma-separated values (CSV) file, you can use the file to add learners. Three different kinds of imports
can be done.
Before you can perform any of these imports, you must create a CSV file. You can also use or modify an existing CSV
file. The CSV file you create must include the correct information.
To add training groups, use a CSV file with each row containing name and description like the following:
To add users to a selected group, use a CSV file with each row containing a login like the following:
To add learners to a training group, use a CSV file with each row containing a login and name like the following:
Notice that in the third example above, you can add the same user to multiple groups in the same CSV file; user
[email protected] has been added to group 1 and group 2 using two separate entries.
Here are some additional tips for using CSV files:
• Because of browser limitations, Adobe recommends that if you have a large number of users to add, that you create
several smaller CSV files instead of one large CSV file.
• Names that contain a comma need to be in quotes. For example, the name John Doe, Jr., must appear in the CSV
file as “John Doe, Jr.” for the file to import correctly.
name, description
group 1, HRTraining
group 2, FinanceTraining
group 3, SalesTraining
group 4, ProductTraining
group 5, MarketingTraining
login
login, group name

59
USING ADOBE CONNECT 8
Adobe Connect Training and Seminars
Last updated 5/14/2013
Add learners using a CSV file
1 Click the Training tab in Adobe Connect Central.
2 Click Users and Groups.
3 Click Import.
4 Select one of the following options:
• Click Create New Groups to have the groups in the imported CSV file (containing rows with name and description)
become their own new training group. This option creates training groups.
• Select Add Existing Users To A Group to have the users in the imported CSV file (containing rows with login
information) added to the group you specify in the drop-down menu.
• Select Add Existing Users To New/Existing Training Groups to have the users in the imported CSV file (containing
rows with login and group name) added to the training group specified as the name value on each row of the CSV
file. Select the Create New Training Groups From CSV File option to create new training groups for any groups
specified in the CSV file that do not exist as a training group in Adobe Connect. When the new training groups are
created, users are added if their login appears on the same row in the CSV file as the new group. (If the Create New
Training Groups From CSV File option is not selected, every row in the CSV containing a training group name that
does not already exist will generate an error.)
5 Click Browse, and navigate to the desired CSV file.
6 Click Upload.
When finished uploading, a confirmation message appears stating if the import process was successful. Information
about users and groups imported is also provided. An error report is generated for entries that fail the import process.
Tips for creating training courses and curriculums
Following are some tips for creating training courses and curriculums in Adobe Connect Training:
• Use Adobe Presenter and Adobe Captivate® to create content for courses. Presenter is suitable for the creation of
rapid e-learning content using Microsoft PowerPoint. Adobe Captivate can be used for creating training materials
that must contain complex branching and simulations.
• At the course level, set client-side maximum retries to one and server-side maximum retries to any number. (Set
server-side maximum retries to unlimited if you want learners to have as many attempts as they need to pass.)
• Add curriculum items directly into curriculums, not into folders.
• When adding content from the Content library directly into a curriculum, the content is automatically converted
to a course and tracking is enabled. For example, when you add a PDF file to a curriculum, that file becomes a
course and tracking can be done down to the page level (you can see if learners looked at 7 out of 10 pages or all 10
pages of the file). In addition, a curriculum resource folder is automatically created and any curriculum-specific
courses (that is, content automatically converted to a course for this curriculum) are placed in the folder.
• Communicate with your learners about how to take courses and curriculums, especially any specific settings you
have used. For example, tell them how many times they can attempt to pass a quiz. Also, if you change a curriculum
after making the curriculum available, such as adding or removing items, inform your learners.
• Ask learners to open an item or course in only one browser window and to close that browser window when they
are done.
• When planning to make a large curriculum available, do a test first. For example, ensure that your Adobe Connect
system (network, servers, database, etc.) is set up properly and has sufficient resources to manage the volume of
learners scheduled to enroll in the curriculum.

60
USING ADOBE CONNECT 8
Adobe Connect Training and Seminars
Last updated 5/14/2013
• Minimize changes to your courses and curriculums after you have made them available to learners.
Note: Adobe Connect administrators can change pod, sharing, and other settings to adhere to standards for governance.
These settings affect the layout of virtual classrooms and what you can do in virtual classrooms. For more information,
see
“Working with compliance and control settings” on page 163.
More Help topics
“Creating a course” on page 60
“Creating a curriculum” on page 67
“About changes to course content” on page 63
“Adding and deleting items from a curriculum” on page 71
Creating training courses
Creating a course
A course is content for a set of enrolled learners that also includes usage tracking for each learner. For example, a
course could be a stand-alone presentation offered as part of a curriculum or shown in a virtual classroom.
Note: The material on courses applies only to accounts that include the Adobe Connect Training application.
In creating a course, your workflow involves the following tasks:
1. Create content and add to Content Library
A course is based on existing content, so ensure that you have content such as presentations, PDF files, or image files
stored in your Content Library. Content can be any of the following file types: PPT, PPTX, FLV, SWF, PDF, GIF, JPG,
PNG, MP3, HTML, MP4, F4V, or ZIP. See
“Upload content” on page 145.
2. Start the Course wizard
On the Adobe Connect Central Home page, locate the Create New menu bar and click Course. Alternatively, click
Training
> New Course.
3. Course information
On the first page of the Course wizard you enter background details about the course, such as a name and summary.
(Only the course name is required; all other fields are optional.) You can edit this information after the course is
created.
Note: By default, the Update Information for Any Items Linked To This Item option is selected. Since you are creating a
new course, you probably do not have any items linked to the course yet, but keep this item selected if you think you will
link any items later.
4. Select course content
In this part of the Course wizard, Adobe Connect directs you to the Content library, where you navigate to the content
file you want to use. You can select only one file from the library, and you must have either View or Manage
permissions for this file. After adding content, you can continue in the wizard and enroll learners or save the
curriculum and exit the wizard. (To enroll learners, set up course notifications, or enable e-mail reminders later, you
can edit the course.)

61
USING ADOBE CONNECT 8
Adobe Connect Training and Seminars
Last updated 5/14/2013
5. Enroll learners
Only enrolled users can browse to the course URL and log in to view the course. To enroll large numbers of users, if
you have the Event Management application, present the course as an event.
You can add and delete learners, as required, after the course is created.
6. Set up notifications
A course notification is an e-mail message telling enrollees how to access the course.
When you format your notification, you can use run time fields in the subject line and in the body of the message.
These fields are course information variables that are automatically filled in for you when the e-mail notification is
sent.
You can change the course notifications after the course is created.
7. Set up reminders
Reminders are optional. A course reminder is an e-mail message sent to either all or selected course enrollees after you
set up the course. You can use reminders, for example, to remind enrollees that they are scheduled to take the course
or to notify specific individuals that they are required to complete the course.
More Help topics
“About changes to course content” on page 63
“Edit courses” on page 64
“Creating a curriculum” on page 67
“Creating virtual classrooms” on page 79
“Working with content in the Content library” on page 144
View course information and the enrollee list
After you create a course, you can view information about the course and a course enrollee list.
More Help topics
“Creating a course” on page 60
“Edit courses” on page 64
View course information
You can view or change information about a course from the Course Information page, the page that appears when
you click the course name in the Training folder list. From this page, you can view or edit the information for a specific
course, including the course summary, content, enrollees, and settings for notifications and reminders. Each of these
features is accessible as a navigation link.
Every course has a Course Information page, which is a summary that contains the information displayed in the
following illustration.

62
USING ADOBE CONNECT 8
Adobe Connect Training and Seminars
Last updated 5/14/2013
The Course Information page shows key information about individual courses.
Course Information The course name, ID, summary, open date, close date, course URL, number of slides or pages,
duration, maximum attempts (the maximum number of attempts the enrollee has to pass this course), maximum
possible score, and language.
Training Catalog Settings Details about the Training Catalog options selected when the course was created, such as
self-enrollment procedures and notifications.
Reminder Policy A field that indicates whether a reminder policy is enabled, to whom reminders are being sent, the
date that the next reminder will be sent, and how often reminders are sent. Click the Training tab at the top of the
Adobe Connect Central window. Navigate to the folder that contains the course for which you want to get information.
In the course list, click the name of the course to select it.
View a course enrollee list
1 Click the Training tab at the top of the Adobe Connect Central window.
2 Navigate to the folder that contains the course.
3 In the course list, click the name of the course.
4 Click the Manage Enrollees link in the navigation bar.
A list of enrolled users and groups are shown in the Current Enrollees window on the right.
About notifications and reminders
Notifications are placed in a queue and are sent as follows:
• Notifications set to Send now are sent when you click Send.
• Notifications set up for future dates are processed every night at midnight. On the set date, depending on the
number of notifications in the queue, they are sent within a few minutes or a few hours after midnight PST.
Notifications appear to be sent from whoever creates the course, using the e-mail address specified in their Adobe
Connect account. Any e-mail delivery failure notifications are also sent to that address.

63
USING ADOBE CONNECT 8
Adobe Connect Training and Seminars
Last updated 5/14/2013
All e-mail notifications are sent individually. Recipients do not see the list of other recipients in the message header.
Reminders are placed in a queue and are sent as follows:
• Reminders to be sent starting on the current date are sent shortly after the course is created.
• Adobe Connect sends reminders from the person who creates the course, using the e-mail address specified in the
curriculum creator’s Adobe Connect account. The e-mail reminders are sent individually; recipients do not see the
list of other recipients in the message header. (Also, any e-mail delivery failure notifications are sent to the course
creator’s e-mail address.)
• Reminders set up for future dates are processed every night at midnight. On the set date, depending on the number
of e-mail reminders in the queue, they are sent within a few minutes or a few hours after midnight PST.
More Help topics
“Creating a course” on page 60
“Edit courses” on page 64
About changes to course content
Following are some important points to remember when changing course content:
• When you add content to a course, the content is copied into the course. If you change the original content file, the
change is not carried over to the course. (For more information, see
“Edit courses” on page 64.)
• When you add a course to a curriculum, it is a link to the course and not a copy. If you change a course, the change
is carried over to the course inside a curriculum.
• Try to minimize changes to course content if the current course content has a quiz that users have already taken.
Minimizing changes helps lower the number of versions that exist. It also lowers the number of reports for users
who took earlier versions.
More Help topics
“Tips for creating training courses and curriculums” on page 59
“Adding and deleting items from a curriculum” on page 71
About review modes
Adobe Connect Training contains two review modes: server-side and client-side. It’s important to understand these
review modes, especially if your courses contain quizzes.
Server-side review mode is used only with Adobe Connect Training courses. For courses, a training manager can
specify the maximum attempts a learner has to complete or pass the course successfully. A learner is locked into review
mode in the following cases:
• The learner has passed or completed the course within the set number of maximum attempts.
• The learner has exceeded the maximum number of attempts allowed to pass or complete the course.
Learners can see whether they are locked into review mode two ways:
• The text “[Review Mode]” appears in the browser title bar when a course is opened.
• This message appears at the top of the screen: “You have exhausted all your attempts and are now in Review Mode.
Any choices selected will not be tracked.” (The message most often appears when course is in review mode within
a virtual classroom.)

64
USING ADOBE CONNECT 8
Adobe Connect Training and Seminars
Last updated 5/14/2013
If learners are in review mode and they take any quizzes included in the course, their scores and statuses are not posted
to Adobe Connect. This prevents learners from trying to improve their score after passing a course.
Important: Learners should always open a course or item in only one browser window at a time and close the window
when they finish. Learners may be locked into review mode incorrectly if they open the same item or course in multiple
windows simultaneously.
The server-side maximum retry setting for a course carries over to all Curriculum items that link to the course. Because
the server-side retry setting for the course is the only one that is enforced, Adobe recommends disregarding
curriculum-level maximum retry settings.
Client-side review mode is enforced through the maximum retry setting in presentations created with Adobe Presenter
and Adobe Captivate. Client-side review mode applies only to retries attempted within a single browser session.
However, client-side review mode can persist across multiple browser sessions if the user exits the presentation before
finishing, causing resume data to be sent to the server.
In Adobe Presenter the retry setting is defined in the Quiz Manager pass or fail options. For example, if you set the “If
failing grade allow x attempts” option to 1, users have only one chance to take the quiz. Suppose a user begins taking
the quiz, then leaves it to view a slide that is not part of the quiz or begins a second quiz in the presentation. By exiting
the first quiz while the presentation is still open (a single browser session), the user exhausts the single allowed attempt
and can’t re-enter the quiz. Now suppose that a user enters a quiz, answers one or two questions (but not enough to
pass the quiz), and closes the browser. In this second case, the user exited the presentation but not the quiz. When this
happens, resume data is sent to Adobe Connect and, if the user is permitted another server-side (course-defined)
attempt, the user can open the presentation again and continue working on the first client-side attempt (although it
will be the second server-side attempt).
To prevent possible status and score discrepancies, Adobe recommends setting the client-side maximum retry
attempts to
1. (In both Presenter and Adobe Captivate, the default setting is 1.) A client-side setting of 1 does not mean
that the user has only one chance to complete or pass the course; the course-level setting governs the maximum
number of retries.
Edit courses
If you are an administrator or a user with permission to manage a specific Training library folder, you can manage
courses.
More Help topics
“About changes to course content” on page 63
“About notifications and reminders” on page 62
“About review modes” on page 63
“Working with content in the Content library” on page 144
Edit course information
You can edit course information, which includes the course name, ID, summary, start date, and close date.
1 Click the Training tab at the top of the Adobe Connect Central window.
2 Navigate to the course.
3 In the course list, click the name of the course.
4 Click the Edit Information link in the navigation list.

65
USING ADOBE CONNECT 8
Adobe Connect Training and Seminars
Last updated 5/14/2013
5 Edit the course information. You can change the following information:
Course Name (Required) The name of the course; it appears in the course list and in reports.
Course ID The course number or ID: for example, 100, CS100, and so on.
Summary A course description that appears on the Course Information page.
Course Starts On The date before which users cannot access the course. If you change an existing course’s start date to
a later date, no users (not even those who already accessed the course) can access the course until the new start date.
If some enrollees have already accessed the course, their tracking and quiz information is retained in reports.
Course Closes On The date after which users cannot access the course.
Max Attempts The the maximum number of attempts the enrollee has to pass this course; if you leave Max Attempts
blank, you are allowing an unlimited number of retries.
Max Possible Score The maximum score a user can receive. Use this option for course content that is not already
graded, such as a PDF, or only sends a partial score, such as Captivate content (maximum score is determined by the
content used).
Note: For content that includes multiple scored quizzes, the max possible score for the overall content is not automatically
detected when the content is added to a course. For example, a presentation containing two quizzes, one with a max
possible score of 50 and a second with a max possible score of 40, will report the max possible score of the last quiz taken
(40). For a more accurate total score, consider creating one quiz and distributing the questions throughout the
presentation instead of using multiple quizzes. For example, create a quiz with 10 questions. In the presentation, show 4
content slides, quiz questions 1-5, 8 more content slides, and then questions 6-10.
6 By default, the Update Information for Any Items Linked To This Item option is selected. Keep this selected if you
think you will link any items to the course.
7 Click Save.
Changing the course title or course summary does not change the information on a presentation summary slide. This
slide uses the information specified at the time the presentation was originally published. To change this information,
republish the content and then reselect the content that the course uses.
Change or update course content
You can change or update the content in a course. If you want to update the content, first publish the updated file to
the Content library.
1 Click the Training tab at the top of the Adobe Connect Central window.
2 Navigate to the course whose content you want to change. In the course list, click the name of the course to select it.
3 Click the Select Content link in the navigation bar.
4 Navigate to the folder that contains the content that you want to use for the course.
5 Select the button next to the content that you want to use for the course. You can select new content or an updated
version of the existing content.
6 Click Save.
7 A warning message is displayed. To update the content, click Yes, Update My Content.
Add or remove course enrollees
If you add enrollees to a course, notify the new enrollees. You can also set up reminders for them.

66
USING ADOBE CONNECT 8
Adobe Connect Training and Seminars
Last updated 5/14/2013
If you remove enrollees, they do not receive notification and are no longer able to access the course.
1 Click the Training tab at the top of the Adobe Connect Central window.
2 Navigate to the course.
3 In the list, click the name of the course.
4 Click the Manage Enrollees link in the navigation bar.
5 Do one of the following:
• Select an enrollee or enrollees in the Available Users and Groups list and click Add. (Press Control-click or Shift-
click to select multiple users or groups. To expand a group to select individual members, double-click the group
name. Then select individual users.)
• Select an enrollee or enrollees in the Current Enrollees list and click Remove.
Change settings for course notifications or reminders
Notifications and reminders help you communicate with course enrollees. You can change the settings of pending
notifications and reminders at any time.
1 Click the Training tab at the top of the Adobe Connect Central window.
2 Navigate to the course.
3 In the course list, click the name of the course.
4 Click the Notifications link in the navigation bar.
5 Click Pending Notifications.
6 Under Subject, click the name of the notification or reminder you want to change. (Notifications appear in the
subject list with the notification icon
and reminders appear with the reminder icon .)
7 Click Edit at the bottom of the page.
8 Make changes, such as editing the timing, recipients, or message text. (If you enter e-mail addresses, use commas
to separate the addresses.) To edit the e-mail subject and message using a run time field, copy the field name from
the Run Time Fields list and paste it into the message subject or body. Do not change the run time field text in curly
brackets.
9 Click Send to apply the changes.
Delete a course
Before you delete a course, be aware of the effect of this action:
• The course is removed from the Training library.
• Enrollees can no longer access the course.
• Reports for the course are no longer available. (To prevent access to the course while retaining reporting
information, set the course close date and do not delete the course.)
• No more course reminders are sent, and delayed course notifications are not sent.
• The content used by the course remains in the Content library.
• The course is removed from the item list of any curriculum in which it is included. This affects the curriculum
reports. Be careful when deleting courses that are included in curriculums.
1 Click the Training tab at the top of the Adobe Connect Central window.
2 Navigate to the course.

67
USING ADOBE CONNECT 8
Adobe Connect Training and Seminars
Last updated 5/14/2013
3 Select the check box to the left of the course that you want to delete.
4 Click the Delete button.
5 On the confirmation page, click Delete.
Creating training curriculums
About curriculums
A curriculum can include courses, presentations, and meetings. You can define prerequisites for a curriculum, and you
can design your program so that users can test out of certain curriculum items.
As users complete items in the curriculum, you can track their progress and generate reports to ensure that the
curriculum meets the learning objectives.
The key features of curriculums let you do the following:
• Organize items, such as courses and presentations, in logical groups that support a learning path.
• Define prerequisites and test-outs for items, allowing enrollees to bypass certain curriculum items if they pass the
corresponding test-out item.
• Specify completion requirements - items required to successfully complete the curriculum.
• Send e-mail notifications and reminders to users regarding the curriculum.
• Generate reports that include curriculum statistics.
• View a visual representation of report data using the Training Dashboard.
More Help topics
“Creating a course” on page 60
Creating a curriculum
A wizard guides you through the main steps of creating a curriculum, such as entering curriculum information and
selecting courses for the curriculum. After you create a curriculum, you can complete additional tasks, such as adding
enrollees and sending reminders.
In creating a curriculum, your workflow involves the following tasks:
1. Browse to a curriculum location
You can create or browse to a folder in the Training library that will contain the curriculum (you must have permission
to access the folder). When you determine a location, you click New Curriculum to open the New Curriculum wizard
and create your curriculum in the selected location.

68
USING ADOBE CONNECT 8
Adobe Connect Training and Seminars
Last updated 5/14/2013
Navigating the Training library
A. Determine a location B. Create another folder or add a new curriculum
Note: If you want to save your curriculum in your User Training folder, you can bypass this procedure by simply clicking
the New Curriculum link on the Adobe Connect Central Home page and following the steps to enter curriculum
information.
2. Enter curriculum information
The first page of the New Curriculum wizard lets you enter details, such as descriptive summary information and start
and end dates, about the curriculum. (You must enter the curriculum name, but all other fields are optional.) The
information that you enter in the wizard appears later on the Curriculum Information page, as well as on the page that
enrollees access from their My Training link.
The Custom URL box displays the first part of the URL that users click to access the curriculum. You can leave the box
blank to have Adobe Connect generate a system URL or enter a custom URL in the box. For example, you can enter a
word that describes the curriculum.
Note: The start and end dates that you select override the start and end dates for the individual items in your curriculum.
For example, if you add a meeting with an end date that already passed, but your end date for the curriculum is in the
future, the meeting assumes the end date of the curriculum.
A
B

69
USING ADOBE CONNECT 8
Adobe Connect Training and Seminars
Last updated 5/14/2013
Use the Curriculum Information page to add a name and details about a curriculum.
3. Add items to the curriculum
After you enter curriculum information in the New Curriculum wizard and click Next, a page appears that lets you
add items to the curriculum. When you add an item to a curriculum, you are actually adding a link to the item, not
copying the item in a new location within Adobe Connect.
You can add content from the Content library, a meeting from the Meeting library, a virtual classroom, or any existing
courses to a curriculum. Content added to a curriculum is now automatically converted to a course so it can be tracked
accurately. The new course is added to the automatically created curriculum resource folder. (This folder is in the same
location as the curriculum and has the same name as the curriculum with “Resources” appended to the end.)
After creating a new curriculum, add courses to build the curriculum.

70
USING ADOBE CONNECT 8
Adobe Connect Training and Seminars
Last updated 5/14/2013
Note: If you want to group items in folders, do not add the items using the New Curriculum wizard. Instead, exit from
the wizard, open the curriculum information page for the curriculum, click Add Item, click New Folder, type in a folder
name, click Save, select the new folder (you can also select the root folder or a different folder), click Add Item, and then
add items to the folder. New items are always created at the root level and you can rearrange items by clicking the Move
button. Folders cannot be nested in other folders.
4. Change the order or remove items, if necessary
After adding content and courses, you can change the order of items to alter the learning path. You also have the option
to remove any items.
Note: Although you can move items within a folder, you cannot move items in or out of folders.
5. Select any additional options
The final step when creating a curriculum is to select any options you require from the Additional Options page, such
as adding enrollees, setting prerequisites, and sending notification.
More Help topics
“Creating a course” on page 60
“Edit prerequisites, test-outs, and completion requirements” on page 76
“Creating virtual classrooms” on page 79
“Working with content in the Content library” on page 144
View curriculum information and status
After you create a curriculum, you can view and modify curriculum details on the Curriculum Information page.
More Help topics
“Creating a curriculum” on page 67
“About notifications and reminders” on page 62
Display curriculum information
1 Click the Training tab at the top of the Adobe Connect Central window.
2 Navigate to the folder that contains the curriculum.
3 Select the name of the curriculum in the course list.
View curriculum status information
Viewing curriculum status offers another way to view a summary report.
1 If you’re not on the Curriculum Information page for the curriculum that you want to view, click the Training tab
and browse to the curriculum. Select the curriculum name to open the Curriculum Information page.
2 In the Curriculum Status area, click the View button.
The Reports tab opens on a Summary page. In addition to the same information that appears in the curriculum
information area of the Curriculum Information page, the Summary page includes the following information:
Enrolled Users The number of users enrolled in the curriculum.

71
USING ADOBE CONNECT 8
Adobe Connect Training and Seminars
Last updated 5/14/2013
Users Completed
The number of users that have accessed the curriculum and successfully completed all required items.
This includes all users who have ever been enrolled in this curriculum, whether they are enrolled currently or not.
Users In Progress
The number of users that have accessed the curriculum, but have not yet completed all required
items. This includes all users who have ever been enrolled in this curriculum, whether they are enrolled currently or not.
Note: Two types of users are not included in the curriculum status numbers: first are users that are enrolled in the
curriculum, but have not yet accessed the curriculum and, second, users who have been enrolled in this curriculum in the
past, but have later been deleted from Adobe Connect.
Adding and deleting items from a curriculum
You can add and delete content and courses from a curriculum after a curriculum is created. For example, you can add
any course in your Training library to a curriculum.
Here are a few tips:
• Try to minimize the addition and deletion of courses and content after a curriculum is made available to learners.
• Communicate with learners enrolled in the curriculum. Tell them when content and courses are added or deleted
and ask them to log in to the curriculum so their status updates.
• There is a distinction between including an existing course in a curriculum and creating a new course for a
curriculum. When you add a course to a curriculum and the course exists, the course is not added to the individual
curriculum’s Resources folder. Only items that are automatically created for the first time as a course are
automatically added to the curriculum Resources folder. You can, however, move or copy items into the Resources
folder.
• When a course is added to a curriculum, what is actually added is a link to the course in the Content library. This
allows learners to receive credit for a course even if the course is taken outside the curriculum. To receive credit for
taking the course, the learner must have logged in to the curriculum at least once. (Adobe recommends that
curriculum learners always launch items from within the curriculum.)
• If you delete a required item from a curriculum, the status of learners who have completed all other required items
changes to Complete.
• After a curriculum has been modified (for example, required items have been added or deleted), ask learners to log
back into the curriculum to have their status and scores updated.
• Sometimes, a learner can take a course and then the course is added to a curriculum in which the learner is enrolled.
For the learner to receive credit for having already taken the course, ask the learner to log into the curriculum. Their
status within the curriculum is updated automatically.
More Help topics
“About changes to course content” on page 63
“Working with content in the Content library” on page 144
Add folders and items to a curriculum
After creating a curriculum, you can add folders or items to the curriculum at any time.
Note: Adding or removing items from a curriculum can affect learner transcripts. As a best practice, do not change
curriculums once you have enrolled learners. If you do add or remove items, tell learners about the changes to the
curriculum and ask them to log in to the curriculum to update their status.

72
USING ADOBE CONNECT 8
Adobe Connect Training and Seminars
Last updated 5/14/2013
More Help topics
“Creating a curriculum” on page 67
“About changes to course content” on page 63
“Change the user status field in a curriculum report” on page 88
Add a folder to a curriculum
After you create a curriculum, you can group items in folders to organize your items. For example, you can group a set
of items in a Beginner Topics folder and another set in an Intermediate Topics folder. New folders are always added
at the root level. Folders cannot be nested in other folders.
Note: You add items to a curriculum folder rather than move items already in your curriculum into a folder.
1 If you’re not on the Curriculum Information page for the curriculum that you want to modify, click the Training
tab and browse to the curriculum. Select the curriculum name to open the Curriculum Information page.
2 Click Add Item.
3 Click New Folder.
4 On the New Folder page, enter a name for the folder in the Folder Name box, and click Save.
5 In the curriculum list, you can select the folder that you created and add items to it.
Add content to a curriculum
After you create a curriculum, you can add more content as necessary. Content added to a curriculum is now
automatically converted to a course so it can be tracked accurately. The new course is added to the automatically
created curriculum resource folder. Any further content you add to the curriculum is also automatically converted and
placed into the resource folder. This folder is in the same location as the curriculum and has the same name as the
curriculum with “Resources” appended to the end. (If you add courses that you have already created to a curriculum,
those courses are not placed in the resources folder.)
1 If you’re not on the Curriculum Information page for the curriculum that you want to modify, click the Training
tab and browse to the curriculum. Select the curriculum name to open the Curriculum Information page.
2 Click Add Item.
3 Click Add Content.
4 If necessary, browse to the folder that contains the content.
5 Select the check box for the content that you want to add to the curriculum, and click Add.
6 Click Add again.
Add a course, virtual classroom, or meeting to a curriculum
Any courses available in your Training library are available for you to include in a curriculum.
1 If you’re not on the Curriculum Information page for the curriculum you want to modify, click the Training tab
and browse to the curriculum. Select the curriculum name to open the Curriculum Information page.
2 Click Add Item.
3 Do one of the following:
• Click Add Course.

73
USING ADOBE CONNECT 8
Adobe Connect Training and Seminars
Last updated 5/14/2013
Note: Invitations, enrollments, and reminders that you created for a course are not carried over when you add a course
to a curriculum. The notification options for a curriculum apply to all courses inside the curriculum; you cannot set
individual notification settings for courses inside a curriculum. (If a course exists outside a curriculum, however, the
course invitation, enrollment, and reminder settings are all valid for the course.)
• Click Add Virtual Classroom.
• Click Add Meeting.
Note: To send an Outlook Calendar Event, which lets users add the meeting to their Outlook calendars, you select the iCal
option when you send meeting reminders, not when you add the meeting to your curriculum.
4 If necessary, browse to the folder that contains the course, classroom, or meeting.
5 Select the check box for the course, classroom, or meeting that you want to add to the curriculum, and click Add.
Add external content to a curriculum
A curriculum is not limited to Adobe Connect items. You can include external training. For example, you can add a
classroom lecture that enrollees should attend. Since a lecture is a live event, you can create an external event to
represent the lecture. By using the status override feature, you can then mark the enrollees that attend as “Complete.”
Note: When the user status changes for external training, update the user’s completion status manually.
1 If you’re not on the Curriculum Information page for the curriculum that you want to modify, click the Training
tab and browse to the curriculum. Select the curriculum name to open the Curriculum Information page.
2 Click Add Item.
3 Click New External Training.
4 In Title, enter the name of the external training.
5 (Optional) In ID, enter identification text or numbers.
6 If the external training item is viewing a website, in the URL box enter a full URL including http. For example,
http://www.adobe.com.
7 In Max Possible Score, enter the maximum points to be awarded for completing the external training.
Note: If you plan to use external content as a course within a curriculum, it can be important to set maximum score.
Define a maximum score in this location when content is non-graded or when it sends a partial score. For example,
Captivate content only sends the score achieved, say 8, not the score achieved and the maximum possible score, say 8/10.
When the content used to create a course includes a full score, such as 8/10, then the maximum possible score defined
within the content applies and any score set here is ignored.
8 (Optional) In Summary, enter a description of the external training.
9 Click Save.
On the Curriculum Information page, the external training appears in your list of items.
Edit curriculums
You can edit information in a curriculum, such as changing the order of items or removing items. You can also delete
any entire curriculum
Note: Adding items to or removing them from a curriculum can affect learner transcripts. As a best practice, do not
change curriculums once you have enrolled learners. If you do add or remove items, tell learners about the changes to the
curriculum and ask them to log in to the curriculum to update their status.

74
USING ADOBE CONNECT 8
Adobe Connect Training and Seminars
Last updated 5/14/2013
More Help topics
“Adding and deleting items from a curriculum” on page 71
“Tips for creating training courses and curriculums” on page 59
“Working with content in the Content library” on page 144
Edit curriculum information
1 If you’re not on the Curriculum Information page for the curriculum that you want to modify, click the Training
tab and browse to the curriculum. Select the curriculum name to open the Curriculum Information page.
2 In the Curriculum Information area, click Edit to modify the following information:
Name A title for the curriculum.
ID The identification number for the curriculum. (You can assign any code, such as a catalog number.)
Summary The curriculum description.
Curriculum Starts On The date on which the curriculum starts. Users cannot access the curriculum before this date
Note: The start and end dates that you select override the start and end dates for the individual items in your curriculum.
For example, if you add a meeting with an end date that already passed, but your end date for the curriculum is in the
future, the meeting assumes the end date of the curriculum.
Curriculum Closes On The date on which the curriculum ends; select from the pop-up menu or select No Close date.
3 When you finish editing the curriculum information, click Save.
Edit external content information
To edit external content information, you must have already added it to the curriculum.
1 If you’re not on the Curriculum Information page for the curriculum that you want to modify, click the Training
tab and browse to the curriculum. Select the curriculum name to open the Curriculum Information page.
2 In the list of items, click the external training item name.
3 In the External Training Information area, click Edit.
4 In the Item Info area, edit the Name, ID, URL, Max Possible Score, or Summary information, and click Save.
Change the order of items in a curriculum
1 If you’re not on the Curriculum Information page for the curriculum that you want to modify, click the Training
tab and browse to the curriculum. Select the curriculum name to open the Curriculum Information page.
2 Select the check box next to the item that you want to move, and then click either the up or down arrow to move
the item in the list.
Remove items from a curriculum
If you no longer want to include an item in a curriculum, you can remove it without affecting the original item that
exists in its respective library.
1 If you’re not on the Curriculum Information page for the curriculum that you want to modify, click the Training
tab and browse to the curriculum. Select the curriculum name to open the Curriculum Information page.
2 In the list of items, select the check box next to the items that you want to remove, and then click Remove Item.
3 Verify that you do want to remove the selected items, and click Remove.

75
USING ADOBE CONNECT 8
Adobe Connect Training and Seminars
Last updated 5/14/2013
Send notifications or reminders to curriculum enrollees
You can use the notifications feature to send an e-mail message to enrollees. A typical message tells enrollees that the
curriculum is available, provides details about the curriculum, and includes a link to the curriculum. The message can
go to all enrollees, or to a subset of enrollees, such as those who have not completed the curriculum.
The reminders feature, similar to the notification feature, lets you send e-mail messages to enrollees. The primary
difference between notifications and reminders, however, is that the Reminders page lets you send the messages at
specified intervals. The message can go to all enrollees, or to a subset of enrollees.
Note: For users who must adhere to compliance standards, reminders can be set to annually. For more information, see
“Working with compliance and control settings” on page 163.
1 If you’re not already on the Curriculum Information page for the curriculum, go to the Training tab in Adobe
Connect Central and browse to the curriculum. Click the curriculum name to open the Curriculum Information
page.
2 Click Notifications.
3 Click New Notification or New Reminder. (Notifications appear in the subject list with the notification icon
and reminders appear with the reminder icon .)
4 Select a timing option. For reminders, you can set a recurrence option to automatically send out multiple
reminders.
5 Select a recipients option. If you enter e-mail addresses, use commas to separate the addresses.
6 (Optional) Edit the e-mail subject and message text. To edit using run time fields, copy the field name from the Run
Time Fields list and paste it into the message subject or body. Do not change the run time field text in curly brackets.
7 Click Send or Save.
Cancel notifications or reminders
1 If you’re not already on the Curriculum Information page for the curriculum, go to the Training tab in Adobe
Connect Central and browse to the curriculum. Click the curriculum name to open the Curriculum Information
page.
2 Click Notifications.
3 Click Pending Notifications.
4 Under Subject, select the checkbox next to the name of the notification or reminder you want to cancel.
(Notifications appear in the subject list with the notification icon
and reminders appear with the reminder
icon .)
5 Click Cancel Notifications.
6 On the confirmation page, click Cancel Notifications.
Delete a curriculum
Before you delete a curriculum, be aware of the following effects of this action:
• The curriculum is removed from the Training library.
• Enrollees can no longer access the curriculum.
• Reports for the curriculum are no longer available. (To prevent access to the curriculum while retaining reporting
information, set the curriculum close date and do not delete the curriculum.)
• Curriculum reminders are not sent, and delayed curriculum notifications are not sent.
• Deleting a curriculum is a permanent action. Once it is deleted, you cannot recover a curriculum.

76
USING ADOBE CONNECT 8
Adobe Connect Training and Seminars
Last updated 5/14/2013
Deleting a curriculum from the Training library does not affect the library items that constitute the curriculum.
1 Click the Training tab in Adobe Connect Central and browse to the curriculum.
2 Select the check box next to the curriculum and then click Delete.
3 After verifying that you want to delete the selection, click Delete.
Edit prerequisites, test-outs, and completion requirements
After creating a curriculum, you can make many changes such as assigning prerequisites, assigning test-outs, and
editing completion requirements. Adobe recommends using either test-outs or prerequisites, but not both, to create
learning paths. Using both is possible, but it can be time-consuming and complicated to test all of the possible
workflows learners may encounter.
More Help topics
“Edit curriculums” on page 73
Assign prerequisites to an item
Assigning prerequisites enforces learner access to items in a specific sequence. A folder cannot be set as a prerequisite.
Also, external training items should not be set as Required because Adobe Connect cannot automatically track external
items.
Note: Avoid creating redundant prerequisites; they are confusing for learners and may cause performance issues on your
Adobe Connect server.
1 If you’re not on the Curriculum Information page for the curriculum that you want to modify, click the Training
tab and browse to the curriculum. Select the curriculum name to open the Curriculum Information page.
2 In the list of curriculum items, click the name of the item or folder that requires a prerequisite. This procedure refers
to this item as the selected item.
3 In the Prerequisites area, click Edit.
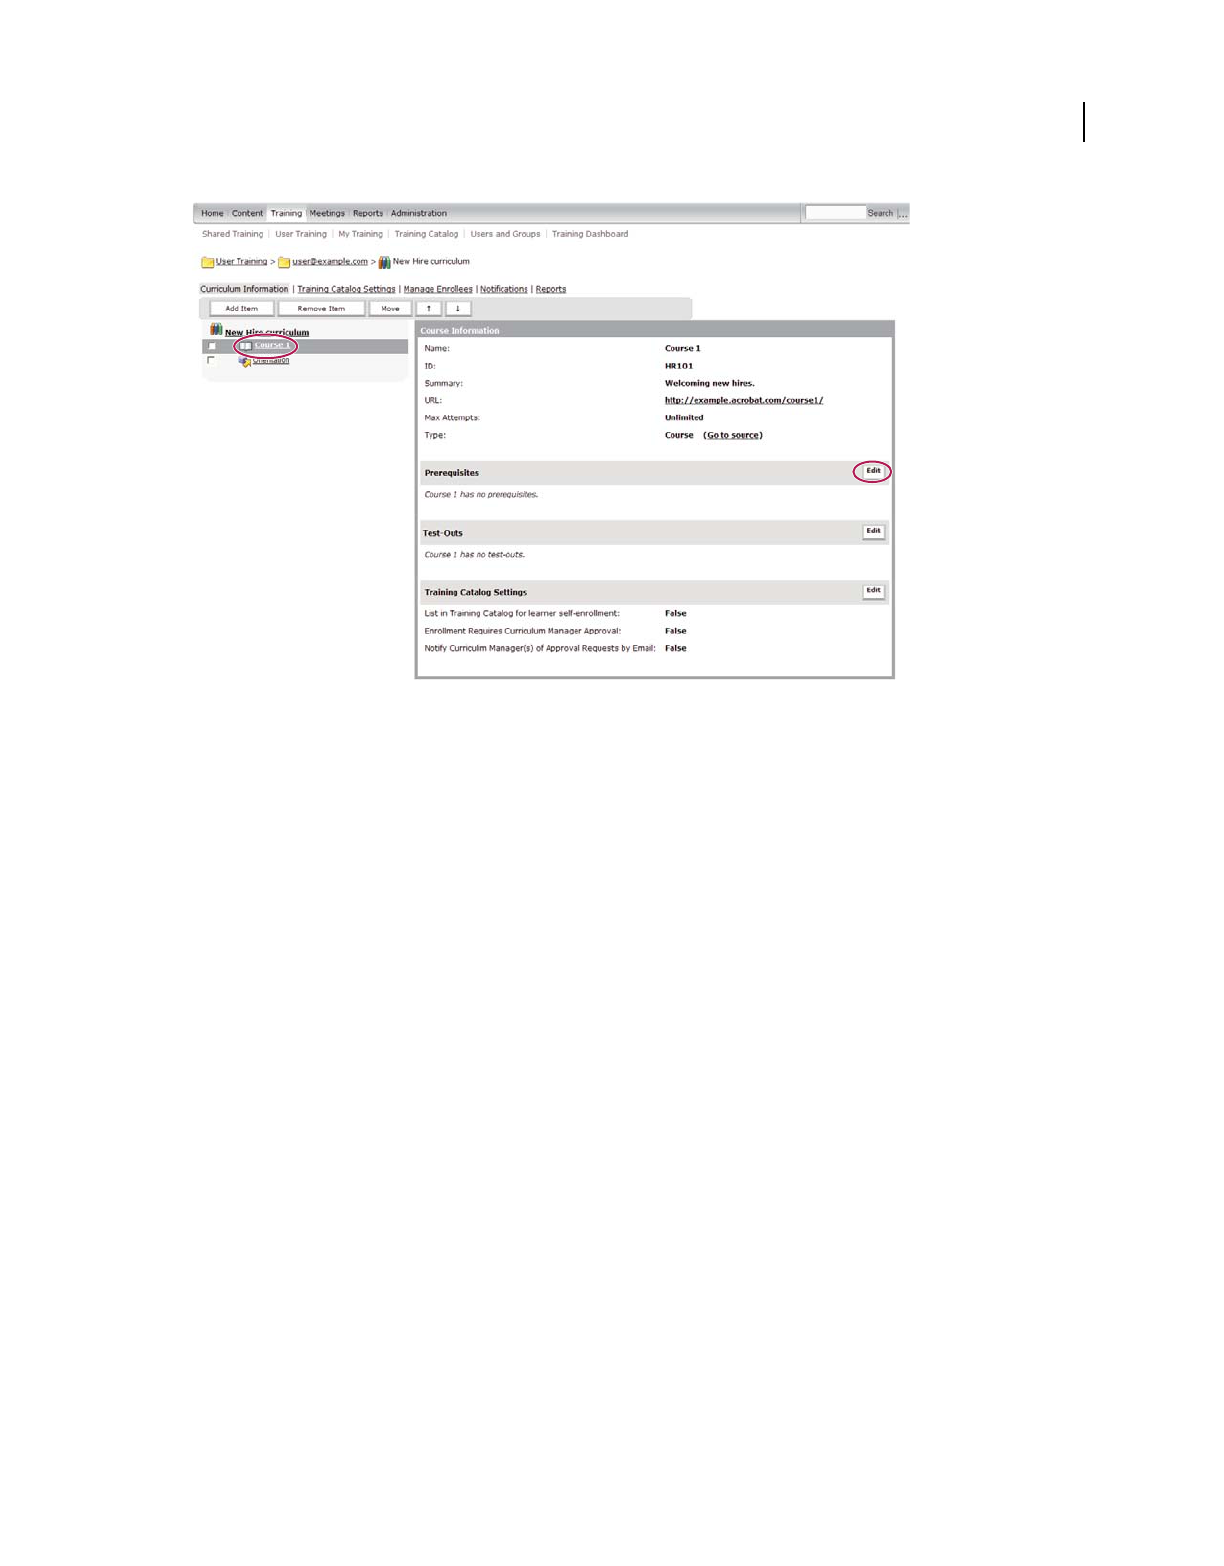
77
USING ADOBE CONNECT 8
Adobe Connect Training and Seminars
Last updated 5/14/2013
In the Course Information Prerequisites area, click Edit to create a specific learning path.
4 The Select Prerequisite area lists the items in the curriculum. Use the Options pop-up menu next to an item to
specify the type of prerequisite:
Suggested Indicates that the prerequisite is optional. Users receive a message requesting that they take the
prerequisite before taking the selected item.
Required Indicates that the prerequisite must be completed successfully, not just completed, before taking the selected
item. Do not assign Required status to external content. Adobe Connect cannot verify completion of external content,
such as a website URL.
Hidden Indicates that the selected item appears on the enrollment page only after the user completes the prerequisite.
5 When you finish selecting prerequisites, click Save.
Assign test-outs for an item
You can design the curriculum so that enrollees are not required to take an item if they pass a related test-out item.
Folders cannot be configured as test-out items or linked as selected items. Always use a specific course or meeting, not
a folder, as a test-out or selected item for any other learning object.
Here are tips for creating test-outs:
• Carefully choose between the Optional, Blocked, and Hidden options. Your learners could have a very different
path and learning experience depending on which option you select for a test-out.
• You cannot assign a test-out for the first item in a curriculum.
• Do not use chained test-outs. An example of a chained test-out is setting item 1 as a test-out for item 2 and then
setting item 2 as a test-out for item 3.
1 If you’re not on the Curriculum Information page for the curriculum that you want to modify, click the Training
tab and browse to the curriculum. Select the curriculum name to open the Curriculum Information page.
2 In the list of items, click the name of the item that requires a test-out item. This procedure refers to this item as the
selected item.

78
USING ADOBE CONNECT 8
Adobe Connect Training and Seminars
Last updated 5/14/2013
3 In the Test-Outs area, click Edit.
4 The Select Test-Outs area lists items in the curriculum. Use the pop-up menu by an item to designate it as a test-
out for the selected item, using the following criteria:
Blocked Indicates that if the enrollee passes the test-out item, the selected item is unavailable to the enrollee. If the
enrollee fails the test-out item, the selected item becomes available.
Optional Indicates that if the enrollee passes the test-out item, the selected item is no longer required to complete the
curriculum.
Hidden Indicates that if the enrollee passes the test-out item, the selected item is hidden from the enrollee. If the
enrollee fails the test-out item, the test-out item is visible and available for the enrollee to take.
5 When you finish specifying test-out items, click Save.
Edit completion requirements
You can designate an item as required, which specifies that an enrollee must successfully complete the item to complete
the curriculum. By default, all items are required, but you can set individual items as optional or required without
impacting other items.
1 If you’re not on the Curriculum Information page for the curriculum that you want to modify, click the Training
tab and browse to the curriculum. Select the curriculum name to open the Curriculum Information page.
2 In the Completion Requirements area, click Edit.
3 For each item that you want to specify as required, select Required from the pop-up menu.
4 When you finish specifying required items, click Save.
Manage curriculum enrollees
Adobe Connect Central allows you to view and add enrollees to a curriculum, as well as set access permissions for
enrollees.
More Help topics
“About notifications and reminders” on page 62
“Edit curriculums” on page 73
View and add enrollees to a curriculum
1 If you’re not already on the Curriculum Information page for the curriculum, go to the Training tab in Adobe
Connect Central and browse to the curriculum. Click the curriculum name to open the Curriculum Information
page.
2 Click Manage Enrollees.
3 To add enrollees, select the name or group in the Available Users and Groups list.
• Press Control-click or Shift-click to select multiple users or groups.
• To expand a group to select individual members, double-click the group name. Then select individual users.
• To search for a name in the list, click the Search button at the bottom of the window; enter the name to display it
in the list, and then select it. (Click Clear to return to the original list.)
4 After selecting the enrollees, click Add.
Note: After adding enrollees, you must send notification to the enrollees that the curriculum is available.

79
USING ADOBE CONNECT 8
Adobe Connect Training and Seminars
Last updated 5/14/2013
Set permissions for curriculum enrollees
After you’ve added enrollees to a curriculum, you can determine permissions for enrolled users and groups.
1 If you’re not already on the Curriculum Information page for the curriculum, go to the Training tab in Adobe
Connect Central and browse to the curriculum. Click the curriculum name to open the Curriculum Information
page.
2 Click Manage Enrollees.
3 Select the enrollee or enrolled group in the Current Enrollees column and click Permissions.
4 Select one of the following permissions:
• Denied prevents the enrollee from accessing the curriculum.
• Enrolled allows the enrollee to access the curriculum.
• Pending Approval enables to the enroll to access the curriculum after they are approved.
Remove enrollees from a curriculum
You can remove an individual curriculum enrollee or a group of enrollees at any time.
1 If you’re not already on the Curriculum Information page for the curriculum, go to the Training tab in Adobe
Connect Central and browse to the curriculum. Click the curriculum name to open the Curriculum Information
page.
2 Click Manage Enrollees.
3 Select the enrollee or enrolled group in the Current Enrollees column and click Remove.
Creating virtual classrooms
About virtual classrooms
Users with the Meeting and Training features installed can create virtual classrooms. Users must be a meeting host and
training manager to create a virtual classroom.
Use virtual classrooms to conduct training sessions. Virtual classrooms are added to a curriculum, just like a meeting.
Unlike a meeting, virtual classrooms can have a Presenter course added that can impact completion requirements.
(Course transcripts are not generated for students who enter a virtual classroom as a guest.)
Note: Completion requirements are no longer user configurable; completion is based on attendance. A learner is marked
complete if they attended at all and marked incomplete if they were absent.
Just like meetings, there are three access levels for virtual classrooms: enrolled students only, enrolled students and
accepted guests, and anyone who has the URL for the virtual classroom can enter the room.
Note: Adobe Connect administrators can change pod, sharing, and other settings to adhere to standards for governance.
These settings affect the layout of virtual classrooms and what you can do in virtual classrooms. For more information,
see
“Working with compliance and control settings” on page 163.
More Help topics
“About content, courses, and curriculums” on page 54
“Creating a curriculum” on page 67

80
USING ADOBE CONNECT 8
Adobe Connect Training and Seminars
Last updated 5/14/2013
Creating a virtual classroom
In creating a virtual classroom, your workflow involves the following tasks:
1. Start the Virtual Classroom wizard
On the Adobe Connect Central Home page, locate the Create New menu bar and click Virtual Classroom.
2. Virtual classroom information
On the first page of the Virtual Classroom wizard you enter background details about the virtual classroom, such as a
name and summary. (Only the virtual classroom name and language are required; all other fields are optional.) You
can edit this information after the virtual classroom is created.
Note: By default, the Update Information for Any Items Linked To This Item option is selected. Since you are creating a
new virtual classroom, you probably do not have any items linked to the virtual classroom yet, but keep this item selected
if you think you will link any items later.
3. Enroll learners
Only enrolled users can browse to the virtual classroom URL and log in to view the virtual classroom. To enroll large
numbers of users, if you have the Event Management application, present the virtual classroom as an event.
You can add and delete learners, as required, after the virtual classroom is created.
4. Set up notifications
A virtual classroom notification is an e-mail message telling enrollees how to access the virtual classroom.
When you format your notification, you can use run time fields in the subject line and in the body of the message.
These fields are virtual classroom information variables that are automatically filled in for you when the e-mail
notification is sent.
You can change the virtual classroom notifications after the virtual classroom is created.
5. Set up reminders
Reminders are optional. A virtual classroom reminder is an e-mail message sent to either all or selected virtual
classroom enrollees after you set up the virtual classroom. You can use reminders, for example, to remind enrollees
that they are scheduled to enter the virtual classroom or to notify specific individuals that they are required to enter
the virtual classroom.
More Help topics
“Creating a course” on page 60
“Creating a curriculum” on page 67
View virtual classroom information
You can view information about a virtual classroom from the Virtual Classroom Information page. This page appears
when you click the virtual classroom name in the Training folder list. From this page, you can view or edit the
information for a specific virtual classroom, such as name, summary, URL, access details, and telephony information.
1 Click the Training tab at the top of the Adobe Connect Central window.
2 Navigate to the folder that contains the virtual classroom.
3 Select the name of the virtual classroom.

81
USING ADOBE CONNECT 8
Adobe Connect Training and Seminars
Last updated 5/14/2013
Virtual classroom templates
If you have the Meeting and Training features installed, a virtual classroom templates folder is automatically installed
under the Shared Training library folder.
For detailed information about templates, see “Meeting room templates and layouts” on page 10.
Apply a template to a new virtual classroom
❖ When creating a new virtual classroom, chose a template from the Select Template menu on the Virtual Classroom
Information Page. By default, the Default Virtual Classroom template is selected.
Convert a virtual classroom into a template
If you are a training manager and meeting host, you can create a virtual classroom template. Move the virtual
classroom to one of two template folders: Shared Templates (in the Shared Training folder) if you want others to be
able to access the template, or My Templates (in your user training folder) if you are the only one who will use the
template.
Note: To add a virtual classroom to the Shared Templates folder, you must have Manager permissions for the folder. By
default, you have full control over virtual classrooms and templates in your user training folder.
1 From the Training tab in Adobe Connect Central, navigate to the folder containing the virtual classroom to convert.
2 In the Name list, click the checkbox next to the virtual classroom.
3 Click Move on the navigation bar.
The name of the virtual classroom is displayed in the left column.
4 Navigate to and select a folder. (Navigate to Shared Training > Shared Templates if you want to share the template
with others.)
5 Click Move.
Your virtual classroom now resides in the template folder that you selected. The template is added to the list in the
appropriate folder, either Shared Templates or My Templates.
When you are creating a new virtual classroom with the New Virtual Classroom wizard, you can select the new
template from the Select Template pop-up menu. You can customize this classroom just like any other to meet your
needs. Once the virtual classroom is created, you cannot apply a new template to it. Instead, you must create a new
virtual classroom by using the new template.
Edit virtual classrooms
There are a variety of tasks you can do to manage and maintain the virtual classrooms you have created.
More Help topics
“Creating virtual classrooms” on page 79
“View virtual classroom reports” on page 83
“Associate an audio profile with a meeting” on page 126
Edit virtual classroom and telephony info
1 From the Training tab in Adobe Connect Central, navigate to the virtual classroom you want to edit.
2 In the Name column, click on a virtual classroom.

82
USING ADOBE CONNECT 8
Adobe Connect Training and Seminars
Last updated 5/14/2013
3 In the navigation bar, click Edit Information.
4 Edit the virtual classroom information and audio conference settings as required.
5 Click Save.
Edit virtual classroom courses
1 From the Training tab in Adobe Connect Central, navigate to the virtual classroom you want to edit.
2 In the Name column, click on a virtual classroom.
3 Click Manage Courses.
4 Add or delete courses as required.
5 Click Save.
Edit virtual classroom enrollees
1 From the Training tab in Adobe Connect Central, navigate to the virtual classroom you want to edit.
2 In the Name column, click on a virtual classroom.
3 Click Manage Enrollees.
4 Add and delete individual enrollees and groups of enrollees as required.
Edit virtual classroom notifications and reminders
You can use the notification feature to send an e-mail message providing details to virtual classroom enrollees,
including a link to the classroom. The message can go to all enrollees, or to a subset of enrollees.
The reminders feature in Adobe Connect Central, similar to the notification feature, lets you send e-mail messages to
enrollees. The primary difference between notifications and reminders, however, is that the Reminders page lets you
send the messages at specified intervals. The message can go to all enrollees, or to a subset of enrollees.
Note: Adobe Connect administrators can change pod, sharing, and other settings to adhere to standards for governance.
These settings affect the layout of virtual classrooms and what you can do in virtual classrooms. For more information,
see
“Working with compliance and control settings” on page 163.
1 From the Training tab in Adobe Connect Central, navigate to the virtual classroom you want to edit.
2 In the Name column, click on a virtual classroom.
3 Click Notifications.
4 Click on a notification or reminder in the list. (Notifications appear in the subject list with the notification icon
and reminders appear with the reminder icon .)
5 Click Edit.
6 Edit the notification or reminder as required. For example:
• Change the timing option. (For reminders, you can set a recurrence option to automatically send out multiple
reminders.)
• Change the recipients. If you enter e-mail addresses, use commas to separate the addresses.
• Edit the e-mail subject and message text. To edit using run time fields, copy the field name from the Run Time
Fields list and paste it into the message subject or body. Do not change the run time field text in curly brackets.
7 Click Send.

83
USING ADOBE CONNECT 8
Adobe Connect Training and Seminars
Last updated 5/14/2013
Edit virtual classroom content
1 From the Training tab in Adobe Connect Central, navigate to the virtual classroom you want to edit.
2 In the Name column, click on a virtual classroom.
3 Click Uploaded Content.
4 Add, delete, and move content as required.
View and edit virtual classroom recordings
You control who can view a virtual classroom recording by setting the recording as public or private. For more
information, see
“Play back a recorded meeting” on page 136
1 From the Training tab in Adobe Connect Central, navigate to the virtual classroom you want to edit.
2 In the Name column, click on a virtual classroom.
3 Click Recordings.
4 View and edit information as required.
View virtual classroom reports
The Reports feature of Adobe Connect Central lets you create reports that show you a given virtual classroom from
different perspectives.
1 If you’re not already on the Virtual Classroom Info page for the classroom, go to the Training tab in Adobe Connect
Central and browse to the classroom. Click the classroom name to open the Virtual Classroom Info page.
2 Click the Reports link, toward the top of the Adobe Connect Central window.
3 The default Summary report shows virtual classroom information and aggregate user information such as a single
instance in which a given user has joined and exited the classroom (Unique Sessions); the last time that any invitee
entered the classroom (Most Recent Session); number of people invited; number of those who attended; and the
greatest number of people who entered the classroom at any one time (Peak Users).
4 Select another report type to obtain different information:
• The By Attendees report lists the name and e-mail address of each virtual classroom participant, as well as the time
they entered the classroom and the time they left it.
• The By Course report lists all courses embedded in the virtual classroom. Click on the different embedded courses
to view a list of the learners that have taken the course. If courses have been updated over time and there are
multiple versions learners have viewed, the reports show which version each learner viewed.
• The By Sessions report lists the start and end time of each session, the session number, and the number of attendees.
Clicking on the session number displays the participant list for this session, including participant name and entry
and exist times for each participant.
• The By Questions report lists each poll by session number, number, and question. You can drill down to two
separate views by clicking the appropriate link under the Report column: “View answer distribution” displays a pie
chart in which each answer is color-coded with a unique color. “View user responses” provides an answer key that
lists each answer for this poll and its corresponding answer number; these numbers map to the pie chart. This
option also shows a list of all the participants who responded in this poll and the number of the answer they selected
(if the poll question allowed multiple responses, these are all shown for the user).
More Help topics
“View and manage curriculum reports” on page 86

84
USING ADOBE CONNECT 8
Adobe Connect Training and Seminars
Last updated 5/14/2013
Set self-enrollment options
Self-enrollment options are set using the Training Catalog. You must add courses, curriculums, and virtual classrooms
to the catalog if you want to use the self-enrollment feature. For more information, see
“Manage the Training Catalog”
on page 91.
Note: Adobe Connect administrators can change self-enrollment and Training Catalog settings to adhere to standards
for governance. For more information, see
“Working with compliance and control settings” on page 163.
1 If you are not already on the information page for the course, curriculum, or virtual classroom, go to the Training
tab in Adobe Connect Central and browse to the item. Click the course, curriculum, or virtual classroom name to
open the information page.
2 Click Training Catalog Settings.
3 Select List in Training Catalog for Learner Self-Enrollment. This enables registered users to add themselves to the
permission list for the course, curriculum, or virtual classroom in the Training Catalog.
4 Do one of the following:
• Select Enrollment Requires Course Manager Approval to require that learners receive approval before being given
access to the course, curriculum, or virtual classroom in the Training Catalog. Select Notify Course Manager(s) Of
Approval Requests By Email to receive an e-mail message each time a learner wants to self enroll. (If you do not
select this option, you’ll need to check the Training Catalog for learners who have Pending status.)
• Select Enrollment Is Open to give all learners access to the course, curriculum, or virtual classroom.
5 Select Display In Training Catalog.
6 Choose a save location in the Training Catalog and click OK. (Remember, content must be in the Training Catalog
before you use the self-enrollment feature.)
7 Click Save.
Monitoring training with reports
Adobe Connect Central offers a wide range of reporting options. For the training features in Adobe Connect Central,
different reports can be generated for courses, curriculums, and virtual classrooms.
More Help topics
“Generating reports in Connect Central” on page 195
Using report filters
As with other applications in Adobe Connect Central, you can further define the information you see on a particular
report by setting report filters. Keep in mind that filters that you set apply to all reports that you create, both for
curriculums and for any other Adobe Connect applications. For more information, see “Setting report filters” in
“View
reports about individual pieces of content” on page 150.

85
USING ADOBE CONNECT 8
Adobe Connect Training and Seminars
Last updated 5/14/2013
View course reports
The Reports feature of Adobe Connect Central lets you create reports that show you a course from different
perspectives. Course reports also enable you to track the performance of specific learners. (When learners access a
course, either from a direct course URL or from the course URL within a curriculum, course reports are created.) To
use this feature, access the Course Information page, and then click the Reports link. This displays other links that let
you define the kinds of report information you can see for this course.
Content and course reports are distinct, because a course is associated with a specific version of content. (In contrast,
course and curriculum reports are shared, because a curriculum is only a link to a course.)
1 Click the Training tab at the top of the Adobe Connect Central window.
2 Navigate to a course.
3 In the course list, click the name of the course.
4 Click the Reports link.
5 To generate a report, click any of the following links:
• Summary shows you course information (name, ID, open date, close date, and URL) and course status (enrolled
users, users completed, users passed, and users failed).
• By Slides/Pages shows a bar graph that lists each slide in the course and the number of times it has been viewed. A
table shows the last time each slide was viewed.
• By Users shows the users who have accessed the course, their status (In Progress, Complete, Passed, or Failed),
score, date taken (user’s most recent attempt), time taken (time of most recent attempt), how many times the user
took the course, the course version, and the certificate number, if applicable. Click the name of a user to view a bar
graph and a table that shows each question and whether the user answered it correctly or incorrectly, as well as the
score for the question. You can also click the View Answers link for each question, which displays the answer
distribution.
• By Questions shows a table that lists question numbers, questions, the number of times the question has been
answered correctly, the number of times the question has been answered incorrectly, the percentage of times the
question has been answered correctly, and the question score.
• By Answers shows a table that lists the maximum possible score, the average score, the high score, and the low score
for the quiz. For each question, the table also shows the question number, the question itself, and the answer
distribution; that is, how each question was answered, if at all. Click the View Answers link to view a pie chart with
a table that provides the answer key and answer distribution. The answer key lists all of the possible answers for the
question and their corresponding answer number or letter; the answer distribution lists all of the answers selected
for this question, flags the correct answer, and shows the number of users who selected each answer, as well as what
percent of the total each number of users represents. Finally, it totals the users by number of users and percent of
users. (The Hide Answer Distribution/Show Answer Distribution button is a toggle that lets you hide the
distribution of answers for each question, then show them again.)
More Help topics
“View and manage curriculum reports” on page 86
“About Connect Central reports” on page 195
Downloading and printing course reports
Except for the Summary report, you can export all course reports to a comma-separated values (CSV) file by clicking
Download Report Data under the report types links.

86
USING ADOBE CONNECT 8
Adobe Connect Training and Seminars
Last updated 5/14/2013
You can also export the By Slides/Pages or By Questions report to a browser window by clicking Printable Version on
the left, above the display.
1 Click the Training tab at the top of the Adobe Connect Central window.
2 Navigate to the course.
3 In the course list, click the name of the course.
4 Click the Reports link.
5 Select a report type (By Slides, By Users, By Questions, or By Answers).
6 Do one of the following:
• Click Download Report Data.
• Click Printable Version.
More Help topics
“View course reports” on page 85
View and manage curriculum reports
You can view reports, which provide summaries, statistical information, and status information about a curriculum.
You can view data for the overall curriculum, for individual users, and by item. Course and curriculum reports are
shared, because a curriculum is only a link to a course. (In contrast, content and course reports are distinct, because a
course is associated with a specific version of content.) Curriculum reports do not display the specific version of a
curriculum a learner completed.
Note: When upgrading from Acrobat Connect 6 to Adobe Connect 7, existing training materials are migrated, but the
data supported in the enhanced Adobe Connect 7 reporting feature will be blank for Connect 6 materials.
Curriculum reports show learner status in several ways:
• In a presentation with no quizzes, Complete is achieved when 100% of the slides in a presentation have been viewed.
• In a presentation with one or more quizzes, In Progress status is listed if all quiz questions with a point value
(nonzero weighted) in all quizzes have not been answered. If all questions with a point value have been answered,
Adobe Connect lists a Passed or Failed depending if the learner score equals/exceeds or is less than the passing
score.
Note: If a course in the curriculum was made available to users before the course was added to the curriculum, any data
that existed for that individual course appears in the curriculum report. If you do not want prior data to appear in the
curriculum report, you can re-create any courses that existed before you created the curriculum.
More Help topics
“Export curriculum reports” on page 90
“Change the user status field in a curriculum report” on page 88
View curriculum status report
A Status report offers general information about a curriculum, including the number of enrollees and the number of
users who completed the curriculum.

87
USING ADOBE CONNECT 8
Adobe Connect Training and Seminars
Last updated 5/14/2013
You can filter the report on start or end dates, groups or users, and people managed directly or indirectly
1 If you’re not already on the Curriculum Information page for the curriculum, go to the Training tab in Adobe
Connect Central and browse to the curriculum. Click the curriculum name to open the Curriculum Information
page.
2 Click the Reports link.
Adobe Connect Central opens, by default, on the Summary report page. In addition to the information that appears
in the Curriculum Information area of the Curriculum Information page (such as Curriculum Name, Curriculum ID,
URL, and open and close dates), the report contains the following information:
Enrolled Users The number of users enrolled in the curriculum.
Users Completed
The number of users that have accessed the curriculum and have successfully completed all required
items. This includes all users who have ever been enrolled in this curriculum, whether they are enrolled currently or not.
Users In Progress The number of users who have accessed the curriculum and who did not successfully meet the
completion requirements. This includes all users who have ever been enrolled in this curriculum, whether they are
enrolled currently or not.
More Help topics
“Export curriculum reports” on page 90
“Change the user status field in a curriculum report” on page 88
View a curriculum report by users
You can view general report data about curriculum enrollees, such as the date on which the user completed the
curriculum.
You can filter the report on start or end dates, groups or users, and people managed directly or indirectly.
1 If you’re not already on the Curriculum Information page for the curriculum, go to the Training tab in Adobe
Connect Central and browse to the curriculum. Click the curriculum name to open the Curriculum Information
page.
2 Click the Reports link, toward the top of the Adobe Connect Central window.
3 Click By Users to view the following information for each enrollee:
Name The name of the enrollee. Click an individual name to obtain details about the enrollee such as status,
cumulative score, and number of attempts made to complete curriculum items.
Status Where the user stands in terms of completing the item.
Date Taken The date and time on which the item was taken by the enrollee.
Certificate # A system-generated number that proves the user completed the curriculum and provides the user with a
unique ID.
4 To change the number of users who appear in the list, select a different number in the Display pop-up menu.
More Help topics
“Export curriculum reports” on page 90

88
USING ADOBE CONNECT 8
Adobe Connect Training and Seminars
Last updated 5/14/2013
Change the user status field in a curriculum report
When you view a curriculum report by user, the override option enables you to change the status of a user. For
example, you could change the status of a user from “In Progress” to “Complete.” You can change the status for
independent courses and for courses within curriculums. You cannot, however, override the status of a user for a
curriculum as a whole.
Overrides are, in general, designed to be used when a situation occurs that may have been out of the user’s control. For
example, an error in the training content that caused a user to fail a course. Overrides are also useful when you want
to manually set a status for external training sessions such as live workshops, attendance at a field trip, or visiting a
website.
The Status field updates each time user status changes for items that Adobe Connect Central tracks. If the user status
changes for an external training, you can manually change the status.
1 If you’re not already on the Curriculum Information page for the curriculum, go to the Training tab in Adobe
Connect Central and browse to the curriculum. Click the curriculum name to open the Curriculum Information
page.
2 Click the Reports link, toward the top of the Adobe Connect Central window.
3 Click By Users.
4 In the Name column, click the name of the enrollee whose status you want to change.
A list of items assigned to the enrollee appears. The status column indicates the status for each item.
5 To change the status of an item, click Override and use the Status pop-up menu to select one of the following:
Passed The user has passed the item.
Failed The user has failed the item.
Complete The user has successfully completed the item.
In Progress The user has clicked at least one time on the item.
6 Enter the user’s score in the Score box. (For items without an associated pass or fail score, you can enter 0.)
7 (Optional) To change the Max Possible Score, navigate to the course information page and change the score there.
8 Click Save.
The updated status appears on the Users report.
More Help topics
“Export curriculum reports” on page 90
View a curriculum report by item
You can view a curriculum report by item, by selecting the item and selecting the type of report you want to view.
You can filter the report by summary, users, slides/pages, questions, or answers.
1 If you’re not already on the Curriculum Information page for the curriculum, go to the Training tab in Adobe
Connect Central and browse to the curriculum. Click the curriculum name to open the Curriculum Information
page.
2 Click the Reports link, toward the top of the Adobe Connect Central window.
3 Click By Item.

89
USING ADOBE CONNECT 8
Adobe Connect Training and Seminars
Last updated 5/14/2013
A list appears of all items in the curriculum. The Reports column indicates the type of report that you can generate for
each item.
4 Click the link for the type of report that you want to view.
The steps for viewing, downloading, and setting report filters for each item are identical to the procedures for viewing
reports in each library. External training, however, is an exception because it does not appear in an Adobe Connect
library.
More Help topics
“Export curriculum reports” on page 90
View a summary report for external training
Before generating a summary report for external training, update the user status or score for users who have completed
the training.
1 If you’re not already on the Curriculum Information page for the curriculum, go to the Training tab in Adobe
Connect Central and browse to the curriculum. Click the curriculum name to open the Curriculum Information
page.
2 Click the Reports link, toward the top of the Adobe Connect Central window.
3 Click By Item.
A list appears of all items in the curriculum. The Reports column indicates the type of report that you can generate for
each item.
4 In the Names column, find the external training item and in the Reports column click Summary.
More Help topics
“Export curriculum reports” on page 90
“Change the user status field in a curriculum report” on page 88
Item Type Report Type
Course Summary
By Users
By Slides/Pages
By Questions
By Answers
Meeting Summary
By Attendees
By Sessions
By Questions
External Training Summary
By Users

90
USING ADOBE CONNECT 8
Adobe Connect Training and Seminars
Last updated 5/14/2013
View an external training curriculum report by users
Before generating a report for external training by users, update the user status or score for users who have completed
the training.
1 If you’re not already on the Curriculum Information page for the curriculum, go to the Training tab in Adobe
Connect Central and browse to the curriculum. Click the curriculum name to open the Curriculum Information
page.
2 Click the Reports link, toward the top of the Adobe Connect Central window.
3 Click By Item.
A list appears of all items in the curriculum. The Reports column indicates the type of report that you can generate for
each item.
4 In the Names column, find the external training item and in the Reports column click By Users to view the
following information for each enrollee:
Name The name of the enrollee. Click an individual name to obtain details about the enrollee such as status,
cumulative score, and number of attempts made to complete external training item.
Status Where the user stands in terms of completing the item.
Score The score the user received for the external training.
Date Taken and Time Taken The date and time on which the item was taken by the enrollee.
Attempts The number of times the user tried to access the external training.
Certificate # A system-generated number that proves the user completed the external training and provides the user
with a unique ID.
Version The specific version of the external training item taken by the user.
Export curriculum reports
You can export curriculum By Item reports to an Excel file by clicking the Download Report Data button on the
Reports page. You have the option of saving or opening the report.
1 Click the Training tab at the top of the Adobe Connect Central window.
2 Navigate to the folder that contains the curriculum.
3 Select the name of the curriculum in the course list.
4 Click Reports.
5 Click By Item.
In the list of report types for each item, you can download report data for all reports on the list except the Summary
report.
6 Click the report type for which you’ll download data.
7 Complete one of the following steps:
• To download the report, click Download Report Data and either save or open the file.
• To view and print a report by slides/pages or by questions in a browser window, click Printable Version.

91
USING ADOBE CONNECT 8
Adobe Connect Training and Seminars
Last updated 5/14/2013
Conducting training with Adobe Connect
Manage the Training Catalog
The Training Catalog gives training managers a way to organize courses and curriculums. For example, a training
manager can make a large number of courses available using the Training Catalog without placing all of the courses
into curriculums. Or, a training manager can create a curriculum and then point learners to a wide variety of
supplemental information in the Training Catalog.
Note: When using the Training Catalog, add all of your learners to the Learners permission group. This enables learners
to view any training options within the catalog. If you want to limit access to certain training options within the catalog,
organize training materials into folders and customize permissions at the folder level.
Adobe Connect administrators set up permissions to the Training Catalog. For more information, see “Configure the
Training Catalog” on page 166.
Note: Adobe Connect administrators can change self-enrollment and Training Catalog settings to adhere to standards
for governance. For more information, see
“Working with compliance and control settings” on page 163.
More Help topics
“Creating a course” on page 60
“Creating a curriculum” on page 67
Open the Training Catalog
When you first begin using the Training Catalog, it may be helpful to create folders to organize information. For
example, you could create folders that represent different departments (Accounting, Human Resources, Facilities, etc.)
or different types of training (Beginning, Intermediate, Advanced, etc.).
1 Click the Training tab in Adobe Connect Central.
2 Click Training Catalog.
3 Click New Folder to begin creating folders and organizing the catalog. You can create folders within folders to set
up a hierarchy.
Setting permissions in the Training Catalog
You can set permissions for folders and items in the Training Catalog. This is useful if you have your Training Catalog
organized in a folder structure and you want to control who can manage and publish to each folder.
1 Click the Training tab in Adobe Connect Central.
2 Click Training Catalog.
3 Select the checkbox next to a folder or item.
4 Click Set Permissions.
5 In the Current Permissions For list, select an individual or group, click Permissions, and select a permissions level
(Denied, View, Publish, or Manage).
Note: By default, the Learners group has View permissions for the root level of the Training Catalog. This default setting
allows anyone in the Learners group to browse through the root level of the Training Catalog. You can change the
permissions to control who can view the Training Catalog.

92
USING ADOBE CONNECT 8
Adobe Connect Training and Seminars
Last updated 5/14/2013
Adding items to the Training Catalog
Only courses, curriculums, and virtual classrooms can be added to the Training Catalog; to use content within the
Training Catalog, turn the content into a course. When you add a course or curriculum to the Training Catalog, you
also specify if learners can enroll themselves.
1 Click the Training tab in Adobe Connect Central.
2 Navigate to the course/curriculum you want to add to the Training Catalog and click on the course/curriculum.
3 Click Training Catalog Settings.
4 Select List in Training Catalog For Learner Self-Enrollment. This enables registered users to add themselves to the
permission list for the course or curriculum in the Training catalog.
5 Do one of the following:
• Select Enrollment Requires Course Manager Approval to require that learners receive approval before being given
access to the course or curriculum in the Training Catalog. Select Notify Course Manager(s) Of Approval Requests
By Email to receive an e-mail message each time a learner wants to self enroll. (If you do not select this option, you’ll
need to check the Training Catalog for learners who have Pending status.)
• Select Enrollment Is Open to give all learners access to the course or curriculum.
6 Select Display In Training Catalog.
7 Navigate to a location within the Training Catalog for the course or curriculum and click OK.
8 Click Save.
Note: Self enrollment information is not included in Training reports.
Informing learners about the Training Catalog
Once you have organized and added content to the Training Catalog, inform your learners.
Note: If you are sending a notification e-mail message to learners about a curriculum and supplemental information for
the curriculum can be found in the Training Catalog, simply edit the notification text to include a link to the Training
Catalog. This gives learners all the information they need in one e-mail message.
❖ Tell learners about the Training Catalog using one of the following methods:
• Inform them that a new Training Catalog tab is now on their Adobe Connect home page.
• Send an e-mail message containing a link to the Training Catalog.
• Place a link to the Training Catalog on your web portal.
Note: A link within an e-mail message or on a web portal can also point directly to a course within the Training Catalog.
Approving training enrollees
If you selected the require approval option when you added courses, curriculums, or virtual classrooms to the Training
Catalog, you’ll need to manage and approve learners when they want to view items in the catalog. Requiring approval
enables you and other training managers to stagger approvals and limit the number of learners that can access a
specific course, curriculum, or virtual classroom at the same time.
1 Do one of the following:
• If you selected the option to be notified by e-mail when learners request approval for a course, curriculum, or virtual
classroom in the Training Catalog, click the link in the e-mail message.

93
USING ADOBE CONNECT 8
Adobe Connect Training and Seminars
Last updated 5/14/2013
• If you did not select the notify by e-mail option, click the Training tab, navigate to the course, curriculum, or virtual
classroom for which you want to approve learners, and click on the course, curriculum, or virtual classroom.
2 Click Manage Enrollees.
3 In the Current Enrollees For list, select an individual with the status of Pending Approval.
4 Click Permission and select Enrolled. (You also have the option to change a learner’s permissions to Denied or
Pending Approval.)
5 In the dialog box that appears, select Yes if you want to notify the learner that they are enrolled.
Conduct a virtual class
The virtual classroom layout is flexible and provides you with many ways to present information and interact with
classroom attendees.
Note: An administrator may have enabled a compliance Terms of Use notice that must be accepted before entering a
virtual classroom. (For more information, see
“Working with compliance and control settings” on page 163.)
1 From the Training tab in Adobe Connect Central, navigate to the virtual classroom you want to enter.
2 Click on a virtual classroom name from the list below the navigation bar.
3 Click Enter Virtual Classroom or click the classroom URL.
4 Manage incoming attendees by approving and denying their requests to enter. For more information, see “Invite
attendees and grant or deny access” on page 15.
5 Conduct training for attendees. Here are some ideas:
• Switch between the Lobby, Classroom, and Analysis virtual classroom layouts. You may want to start with Lobby
which contains a large Chat pod for attendees to introduce themselves to each other. Next, change to the Classroom
layout when sharing courses. Finally, finish in the Analysis layout which offers a Poll pod you can use to ask
attendees to rate their virtual classroom experience.
• Launch courses in the Course Share Pod. Sync and un-sync the course as required. For more information, see
“Invite attendees and grant or deny access” on page 15.
• Interact with attendees through the Attendees pod. Ask attendees questions they can respond to using emoticons
and encourage them to ask questions by virtually raising their hand. For more information, see
“Participating in
training sessions and meetings” on page 94.
• Use the Video pod to broadcast your, or an attendee’s, picture and voice. For more information, see “Enable
microphone for participants using computers” on page 128.
• Move attendees into different sub-rooms so they can collaborate in a smaller group setting. For more information,
see
“Breakout rooms” on page 45
• Use the whiteboard to collaborate with attendees or allow them to collaborate with each other to answer a question
or brainstorm ideas. For more information, see
“Share a whiteboard” on page 33.
• Use the Chat pod to communicate with attendees or answer questions. For more information, see “Chat in
meetings” on page 38.
• Take notes, such as questions to research, information to add to a course, or ideas for improving your virtual
classroom in the Note pod. For more information, see
“Taking notes in a meeting” on page 37.
6 To close the virtual classroom session, select Meeting > End Meeting.

94
USING ADOBE CONNECT 8
Adobe Connect Training and Seminars
Last updated 5/14/2013
Note: Adobe Connect administrators can change pod, sharing, and other settings to adhere to standards for governance.
These settings affect the layout of virtual classrooms and what you can do in virtual classrooms. For more information,
see
“Working with compliance and control settings” on page 163.
More Help topics
“About virtual classrooms” on page 79
“Creating virtual classrooms” on page 79
Participating in training sessions and meetings
Communicate with training or meeting attendees
To create a sense of community within a meeting or training session and encourage attendees to participate, use the
emoticons that appear in the Attendees pod. These emoticons can express an emotion such as laughter or applause,
ask the host to speak louder or slow down, or show raised hands.
Here are a few more tips for communicating with meeting and training attendees:
• Explain to attendees how to use the emoticons and audio together and then support them when they try to use the
features. If attendees are raising their hands, take and answer their questions so they begin to understand how the
communication flow works.
• Be the most active user of emoticons. When an attendee makes a comment, use the emoticons to express laughter
or applaud. If you are busy giving a detailed presentation, enlist the help of another host or presenter to be active
using emoticons and managing the Attendees pod.
• An easy way to keep attendees involved is by asking simple questions they can quickly answer using the Agree and
Disagree emoticons.
• If you have acknowledged an attendee’s raised hand and given them voice rights, you can also allow them to share
their screen. (Hover over their name in the Attendees pod and select Request Screen Share
). This can be helpful
if sharing their screen enables them to clarify a question or provide information.
• In the Attendees pod, hover over an attendee name to mute or unmute their microphone as needed during an audio
conference call.
Note: Adobe Connect administrators can change pod, sharing, and other settings to adhere to standards for governance.
These settings affect the layout of meeting rooms and virtual classrooms and what you can do in the rooms. For more
information, see
“Working with compliance and control settings” on page 163.
More Help topics
“Share content in the Share pod” on page 26
Ask and accept attendee questions
1 Using audio or the Q & A pod, a host asks a question.

95
USING ADOBE CONNECT 8
Adobe Connect Training and Seminars
Last updated 5/14/2013
2 Attendees click the Raise Hand button in the menu bar, and the following occurs:
• Everyone sees the raised hands next to names in the Attendees pod. If multiple attendees raised their hand, the
people who raised their hand soonest appears higher in the list.
• Hosts receive a notification in the upper right of the meeting room with Approve and Decline buttons.
Individual notifications show how many raised their hand and the current attendee’s position in the queue. For
example, 4/10 indicates that the attendee was the fourth of ten attendees to raise their hand.
3 In the Attendees pod, select one or more attendees, and choose Enable Audio from the hover menu. To the right
of the attendee names, the raised hand icon is replaced with the microphone icon .
4 The attendees receive a notification that they can click Speak Now. If the attendee needs to share their screen, hover
over their name in the Attendees pod and select Request Screen Share.
5 When attendees are finished speaking, hover over their names in the Attendees pod, and select Disable Audio .
This practice reduces background noise.
More Help topics
“View and change attendee status” on page 51
“Conducting training with Adobe Connect” on page 91
Attending virtual classroom training
Attending a virtual classroom session gives you the opportunity to learn new information and participate interactively
in the classroom experience.
1 Click the virtual classroom URL link sent to you (by e-mail or IM) from the classroom host.
2 Enter your login information.
3 Participate in the virtual classroom. Here are some ideas:
• If attendees are using the Chat pod to introduce themselves, add your name, and perhaps location, to the
conversation.
• The Course Share Pod is where the host shares their screen or content such as a presentation or document. The
Share pod is probably where you will direct most of your attention during a classroom session. If a presentation
contains a quiz, the host can un-sync the presentation, allowing individual attendees to take the quiz on their own.
• Use emoticons in the application bar to interact with the host and other attendees. You can raise your hand, express
agreement or disagreement, and even ask the host to speak more loudly or softly. The emoticons are an easy way to
start participating in the classroom.
• Raise your hand and if the host approves your request, use the VoIP toolbar to broadcast your voice. This is useful
if you have a detailed question to ask or if you want to provide information to the class.
• If the host opens a whiteboard, collaborate with other attendees on the task at hand. Whiteboards allow a group of
attendees to answer a question together and are also useful for brainstorming ideas. For more information, see
“Share a whiteboard” on page 33.
• Throughout the session, use the Chat pod to communicate with attendees or answer questions. Hosts can allow
private chat between attendees or they can turn off this feature. For more information, see
“Chat in meetings” on
page 38.
• At the end of a session, the host may take a poll. Simply read the question and vote using the radio buttons.
4 When the session is finished, the host closes the virtual classroom.

96
USING ADOBE CONNECT 8
Adobe Connect Training and Seminars
Last updated 5/14/2013
More Help topics
“Communicate with training or meeting attendees” on page 94
Self-enrollment in training courses
Training managers make training courses, curriculums, and other items available to registered users through the
Training Catalog, you can enroll yourself.
1 From the Adobe Connect Home page, click Training Catalog.
2 In the course list, select a course and click Enroll.
Your status for that course changes to Pending. An e-mail message is sent to you stating that you asked for course
approval and a separate message is sent to the training manager asking for their approval.
3 If the training manager approves your request to enroll, you receive an e-mail message with your new status and a
link to the course. Your status changes from Pending to Enrolled. When you are ready, click the course link in the
e-mail message and take the course.
More Help topics
“Communicate with training or meeting attendees” on page 94
“Attending virtual classroom training” on page 95
Creating and managing seminars
About seminars
Use Adobe Connect Seminars to create a special type of meeting. Seminars bring attendees to a meeting room on a
specific day between set start and end times. The seminar exists only for that period of time. (By contrast, the meeting
room in which the seminar occurs exists before, during, and after the seminar.)
Unlike a meeting, which normally has ten people or fewer and can recur, a seminar has a minimum of 50 participants,
is often a one-time or infrequent event, and involves little audience participation. At least one seminar presenter or
host must be in the room in order for others to enter, even if the seminar is public. A seminar ends if all the presenters
and hosts exit the room. The default seminar room looks different from the default meeting room. Also, seminars can
be created only in a shared seminars folder, whereas meetings can be created either in a shared folder or a user folder.
Note: Adobe Connect administrators can change pod, sharing, and other settings to adhere to standards for governance.
These settings affect the layout of seminar rooms and what you can do in seminar rooms. For more information, see
“Working with compliance and control settings” on page 163.
More Help topics
“About meetings” on page 5
“Record a meeting” on page 133
Pre-seminar tasks
Careful pre-seminar planning helps a seminar run smoothly and streamlines follow-up activities.

97
USING ADOBE CONNECT 8
Adobe Connect Training and Seminars
Last updated 5/14/2013
1. Determine how many seminar licenses you have
If your organization purchased Seminars, it obtained a specific number of seminar licenses. The number of seminar
attendees should never exceed the number of concurrent users allowed for your license. Your Seminars administrator
has information about how many licenses your organization purchased and how many concurrent seminars you can
conduct at a time. If you think you may need more licenses, let the administrator know early.
2. Access the Seminar library
Seminar files and folders are stored in the Seminar library. Users who have the correct permissions can manage and
organize these files and folders. You reach the Seminar library through the Seminar Rooms tab.
Note: The seminars you are scheduled to attend appear on the Home tab of your Adobe Connect Central application
under “My Meetings,” not the Seminar Rooms tab.
3. Establish permissions
Attendance permissions define attendee roles in a seminar, such as participant, presenter, and host. You assign these
permissions when you create a seminar. The seminar host can also modify them during the seminar and after the
seminar is over by editing the participant list.
Seminar library permissions determine who can manage the library folders. Of the six built-in groups, only
administrators have Manage permissions for the Shared Seminar folder. Authors, training managers, meeting hosts,
seminar hosts, and event managers are assigned Denied permissions by default. The administrator can override those
default permissions and allow others access to the Shared Seminar folder. (There are no Publish or View permission
types as there are for the Content library.) To manage folders other than the Shared Seminar folder, you must have
Manage permissions for that folder in the Seminar library.
4. Register and approve attendees
Depending on the type and purpose of a given seminar, the seminar host may want to have the guests register. If so,
the host must have Adobe Connect Events as part of the Adobe Connect Central application; registration for any
meeting, training, presentation, or seminar can only be done through the Event Management tab. If the host has this
tab, they must first create the seminar from the Seminar Rooms tab using the Seminar wizard. Then, they create an
event and select the seminar they have created as the event.
More Help topics
“Working with content in the Content library” on page 144
Creating a seminar
After obtaining correct permissions, create seminars using the Seminar wizard.
1. Start the Seminar wizard
Create or browse to a folder in the Seminar library that will contain the seminar (you must have permission to access
the folder). When you determine a location, click the New Seminar button to open the wizard.
2. Enter seminar information
On the first page of the Seminar wizard, enter background details about the seminar, such as a name and summary,
and select a template to use. (Only the seminar name and language are required; all other fields are optional.) You can
edit this information after the seminar is created.

98
USING ADOBE CONNECT 8
Adobe Connect Training and Seminars
Last updated 5/14/2013
3. Select seminar participants
If your seminar is limited to invited guests only, the next step is to select the seminar participants. For a seminar limited
to registered guests and accepted users, you can select users and groups to be participants or presenters in your
seminar. These users will be able to log in to the seminar directly. Uninvited users who have the URL to the seminar
meeting room can attempt to log in as guests. In this case, as a host, you can grant admission to guests on an individual
basis.
4. Send invitations
The final step is to send participants e-mail invitations containing the date, time, duration, and location of the seminar.
Send invitations as you create the seminar, or create and send the invitations at a later time.
More Help topics
“Pre-seminar tasks” on page 96
Send seminar invitations
Send invitations as you create a seminar, or create and send the invitations at a later time.
After a seminar begins, you can contact invitees by sending en e-mail or instant message directly from the seminar.
For more information, see “Contact invitees from a meeting” in
“Invite attendees and grant or deny access” on page 15.
1 On the Seminar Information page, select Invitations.
2 Do one of the following:
• If your seminar is for registered users only or registered users and guests, select an invitee category from the To
pop-up menu, edit the subject and the message body as appropriate, and attach an Outlook calendar event to the
e-mail if desired.
• If your seminar is for anyone who has the URL for the seminar, click Send E-mail Invitations, enter e-mail addresses
in the To text box, and edit the subject and message text if necessary.
3 Click Send.
Note: The system can generate an individual attendance report for registered users. Accepted guests are represented in
the total number of attendees, but no individual attendance report is available for accepted guests.
View seminar information
To view or modify an existing seminar, you must have both of the following permission types:
File management permissions You must have Manage permissions for the seminar folder or file, because when you
change a seminar that you created, you are effectively changing the file or folder in the Seminar library.
Attendance permissions You must be the host for the seminar, because you are also changing the parameters of the
seminar itself.
View a seminar profile
1 Click the Seminar Rooms tab at the top of the Adobe Connect Central home page.
2 Navigate to the folder that contains the seminar and select the seminar name.
View a seminar participants list
If you have Manage permissions for a seminar, you can view a list of all invited participants for each seminar room.

99
USING ADOBE CONNECT 8
Adobe Connect Training and Seminars
Last updated 5/14/2013
Note: If this seminar is presented as an event, you must view the information in the Event Management tab. For
information, see
“Adobe Connect Events” on page 102.
1 Click the Seminar Rooms tab at the top of the Adobe Connect Central home page.
2 Navigate to the folder that contains the seminar and select the seminar name.
3 Click the Edit Participants link.
View a list of content uploaded from a seminar
If you have Manage permissions for a seminar folder, you can view a list of all content that has been uploaded to the
server from a seminar room within that folder.
1 Click the Seminar Rooms tab at the top of the Adobe Connect Central home page.
2 Navigate to the folder that contains the seminar and select the seminar name.
3 Click the Uploaded Content link. A list of uploaded content appears.
4 To view information about an item, click its name.
5 To change the title or summary of the piece of uploaded content, click Edit, make your changes on the Edit page,
and click Save.
6 To return to the uploaded content list, click Return To Uploaded Content.
View a seminar recordings list
You can view a list of any seminars that have been recorded.
1 Click the Seminar Rooms tab at the top of the Adobe Connect Central home page.
2 Navigate to the folder that contains the seminar and select the seminar name.
3 Click the Recordings link.
4 To view information about an item, click its name.
5
To change the title or summary of a specific recording, click Edit, make your changes on the Edit page, and click save.
View seminar folder license information
You can view information about how many seminar licenses your organization purchased. This can be helpful when
planning the number of people to invite to a seminar.
1 Click the Seminar Rooms tab at the top of the Adobe Connect Central home page.
2 Navigate to the seminar folder.
3 Click License Info.
Note: If you create a seminar under a seminar license folder that has a start date in the future, no one will be able to enter
the Seminar room.
Edit seminars
If you are an administrator or have Manage permissions for a seminar folder, you can add participants, remove them,
and change participant permission roles (host, presenter or participant).
Edit seminar information
1 Click the Seminar Rooms tab at the top of the Adobe Connect Central home page.

100
USING ADOBE CONNECT 8
Adobe Connect Training and Seminars
Last updated 5/14/2013
2 Navigate to the folder that contains the seminar and select the seminar name.
3 Click the Edit Information link.
4 Edit the options as necessary. For details, see “Edit meeting information” on page 22.
5 Click Save.
Add or remove seminar participants
You can add or remove seminar participants at any time.
1 Click the Seminar Rooms tab at the top of the Adobe Connect Central home page.
2 Navigate to the folder that contains the seminar and select the seminar name.
3 Click the Edit Participants link.
4 To add participants, do one of the following in the Available Users And Groups list. To remove participants, do one
of the following in the Current Participants list:
• To select multiple users or groups, Control-click or Shift-click.
• To expand a group to select individual members, double-click the group name.
• To search for a name in the list, click Search at the bottom of the window, enter the name to display it in the list,
and then select it.
5 Click Add or Remove as required. (If you expanded a group to select individual members, you can double-click Up
One Level in the list to restore the original list.)
6 (Optional) If you added participants, set permissions. From the Set User Role menu at the bottom of the Current
Participants list, assign a permission type (participant, host, or presenter) for each user or group you added.
Change a seminar participant’s role
Seminar participants can be assigned the following roles: presenter, participant, or host.
1 Click the Seminar Rooms tab at the top of the Adobe Connect Central home page.
2 Navigate to the folder that contains the seminar and select the seminar name.
3 Click Edit Participants.
4 In the Current Participants list, do one of the following:
• To select multiple users or groups, Control-click or Shift-click.
• To search for a name in the list, click the Search button at the bottom of the window, enter the name to display it
in the list, and then select it.
5 For each name, select the new user role (presenter, participant, host, or Denied) from the pop-up Set User Role
menu at the bottom of the Current Participants list.
6 Click a link in the navigation bar to perform another task or click Seminar Information to view details about the
seminar.
Viewing data about seminars
The Seminar Dashboard provides a graphical representation of statistical data about your seminars. Click the Seminar
Dashboard link under the tab bar, at the top of the Seminar’s window.

101
USING ADOBE CONNECT 8
Adobe Connect Training and Seminars
Last updated 5/14/2013
The data, which reflects all the seminars you have created, appears in three bar graphs; click any of the bar graphs to
view the Summary Report for this seminar.
Most Active Seminars Over Last 30 Days Determined by the number of sessions.
Most Participants Seminars Over Last 30 Days Determined by the number of participants.
Most Viewed Recordings Over Last 30 Days Determined by the number of viewings (that is, the number of times each
archived seminar has been viewed).
You can click any individual seminar in any of the three bar graphs to view more detailed information about the
seminar.
Seminar reports
Use the Reports feature of Adobe Connect Central to create reports that summarize seminar information from
different perspectives. Reports are created from the Reports link on the Seminar Information page.
More Help topics
“Generating reports in Connect Central” on page 195
Join a seminar from Adobe Connect Central
If you are scheduled to attend a seminar, the seminar name appears in the My Meetings list on the Home tab in the
Adobe Connect Central window. In addition, if you have Outlook and have accepted the invitation to the seminar, the
seminar appears on your Outlook Calendar. (Seminars you create are listed under the Seminar Rooms tab.)
You can determine if the seminar you are joining is already in progress by checking the date and time shown for the
seminar. If the date is in the past, the seminar appears on your meeting list under expired meetings, but you can still
enter the room to view content.
1 Click My Meetings.
2 Next to the seminar you want to attend, click Open.

102
Last updated 5/14/2013
Chapter 4: Adobe Connect Events
Adobe® Connect™ Events enables users to manage the full life cycle of large or small events, including registration,
invitations, reminders, and reports. Connect Events can be used with meetings, seminars, presentations, or training.
An event generally involves many participants, so it requires careful pre-event planning and post-event management.
About Adobe Connect Events
Events overview
An Event is a meeting, seminar, presentation, course, curriculum, or virtual classroom wrapped with pre-event and
post-event management features. Event management features include registration, reminders, and event-tracking
surveys and reports.
Consider creating an event in the following situations:
• You want participants to register. You also want the option to screen participants for the event based on their
registration information.
• You want to create branded event pages, such as listing and description pages that publicize the event as well as
branded registration and login pages.
• You want to customize the collected participant data for your reports. Because this data is based on registration
information, it supplements the reports that relate to event content, such as the responses to quiz questions given
in a course or polling questions for a meeting.
• You want people outside your organization to participate. Events are often listed on public websites, so many
participants can find your event there and register at the site.
• You want to send automatically generated e-mail messages, such as invitations, reminders, registration
confirmations, and thank you notes.
• You want to track individual campaigns, such as e-mail offers, search engine campaigns, or banner ad campaigns.
An event has three phases:
• Pre-event tasks include determining the number of licenses available, creating content, establishing permissions,
and inviting, registering, and reminding event participants.
• In-event activity requires the attendance of participants and sometimes presenters (if the event includes a meeting
or seminar).
• Post-event tasks include redirecting the participant’s browser to a specific URL, answering outstanding questions
from participants, and monitoring various event-tracking activities through surveys and reports.
More Help topics
“Best practices for events” on page 104
“Creating an event” on page 105

103
USING ADOBE CONNECT 8
Adobe Connect Events
Last updated 5/14/2013
Pre-event tasks
Careful pre-event planning and task maintenance can ensure that events run smoothly and that post-event activities
can be completed quickly.
1. Determine how many licenses you have
Before you set up an event, determine how many licenses you have. If more people register for the event than you have
licenses for, potential participants cannot join the event when they try to log in. Check with your Connect Central
administrator for licensing issues.
2. Specify content for the event
Before you create an event, the content for the event must exist in Connect Central. (When you are setting up the event
with the Event wizard, you must specify the content, meeting, course, curriculum, virtual classroom, or seminar on
which to base your event.) The following list shows several examples:
• To create a training event using a course or curriculum, the course or curriculum must exist in the Training library.
• To present content as an event, the content must be stored in the Content library.
• To use a meeting or a seminar as an event, the meeting or seminar must exist in the Meetings or Seminar library.
3. Establish event permissions
Permissions are important because they determine who can participate in, view, and manage events. Attendance
permissions determine the roles and functions of attendees. The event manager assigns attendee’ roles when setting
up the event.
Note: Attendee roles appear in the Role column of the My Scheduled Events list in Manager.
Attendees can have the following roles and permissions:
Invited People who are sent an invitation to the event and are invited to register for the event.
Denied A person who has registered, but is not given access to the event by the host.
Pending Approval A person whose registration has not been approved by the event manager.
Participant People who attend the event as guests or as registered users from your organization. They have limited
permissions.
Presenter A person who shows content to attendees. Presenters are assigned Presenter permissions.
Host The person who has full control of a meeting or seminar room used for an event. The host has full Presenter and
Manage permissions and can assign permissions to others.
Note: The Presenter and Host roles are used for live events (meetings and seminars) only. For all non-live events, only the
Participant, Invited, and Denied roles are used.
Event library permissions define who can create events, modify events, and perform the tasks associated with the Event
library files and folders, such as adding and deleting files. The file management permissions are Manage and Denied.
4. Register and approve attendees
Events require registration but don’t always require approval. By default, an event does not require approval, but you
can change the setting when you create the event. If you do not require approval, anyone who registers is approved
automatically and can attend the event, providing you have a sufficient number of licenses. (As the event host, you can
always deny approval to anyone before the event occurs.) Requiring approval lets you control who attends the event.

104
USING ADOBE CONNECT 8
Adobe Connect Events
Last updated 5/14/2013
More Help topics
“Best practices for events” on page 104
“Creating an event” on page 105
In-event tasks
Much of the work involved in creating an event occurs during the content creation and pre-event stages. If the correct
content exists and you have completed the pre-event tasks, the actual event should go smoothly. But you may need to
complete a few tasks during an event, especially if it is live.
Non-live on-demand events Events that do not happen in real time. Participants click a link to view a presentation or
take self-paced course or curriculum. You can notify potential participants of the event through an e-mail invitation
or by publishing the event on the public events listing page of the organization website. Both the e-mail invitation and
the website listing contain a link that opens a registration form for the event. In many cases, no in-event tasks take
place during non-live events.
Live events Scheduled, real-time events. During the event, it may be necessary to coordinate multiple presenters or
approve attendees.
More Help topics
“Best practices for events” on page 104
“Creating an event” on page 105
Post-event tasks
After an event, there are several tasks and administrative activities to perform.
Thank attendees Send a thank you e-mail message to attendees. Also, consider sending an e-mail message to people
who were not able to attend.
Create a post-event URL Direct attendee browsers to a post-event URL where they can view product information and
complete surveys. You can customize both the absentee and thank you follow-up e-mail messages so that they include
the post-event URL.
Read reports View event reports to obtain statistical data and participant information. Reports enable you to assess
the success of the event and make needed adjustments to future events.
View the Event dashboard Refer to the Event dashboard for a graphical representation of statistical data about the last
10 of your most active events. The dashboard data reflects the last 10 most active events over the past six months, in
your My Events folder.
Check the library Organize the event files in your library.
More Help topics
“Pre-event tasks” on page 103
“Creating an event” on page 105
Best practices for events
Here are some tips and tricks that you can use for your own events:
• Create a lobby. The lobby can be a Chat pod where participants meet and greet each other before the event begins.

105
USING ADOBE CONNECT 8
Adobe Connect Events
Last updated 5/14/2013
• Use PowerPoint animations. Appropriate use of PowerPoint animations can bring an event to life with motion and
sound. Don’t add so many, however, that the animations become distracting.
• Incorporate polls into your event. Polls give you instant feedback so you know if your message is getting through
and provide an easy way for your audience to actively participate in the event.
• Leverage video assets. If you have appropriate video files, add them to your events.
• Coordinate carefully between co-presenters. Choose Meeting > Enable Presenter Only Area to include items such
as an agenda with notes and moderated Q & A. Consider giving presenters “enhanced participants rights” versus
“presenter rights.”
• With all content preloaded, do a dry run before the event, at the same time of day you intend to give the event
(network traffic differs by time of day). Use the exact hardware and network connections you plan to use for the
real event.
More Help topics
“Events overview” on page 102
“Creating an event” on page 105
Creating and editing events
Creating an event
You create an event using the Event wizard, which guides you through the tasks of creating a name and summary,
selecting an image to associate with the event, selecting the content, determining participants, and defining the
different phases in your event in which e-mails are sent to participants.
Events are built around content, such as a course or curriculum, a meeting, or a seminar. This means that the content
must already exist in the appropriate library before you create the event; you cannot create the content when you create
the event. You can use any single file stored in your Content, Meetings, Training, or Seminar library.
1. Start the Event wizard
You start the Event wizard by Clicking the Event Management tab in Connect Central, navigating to the folder that
will contain the event, and clicking New Event.
To quickly copy settings from an existing event, select it, and click Duplicate Event. Then enter a unique name and
any other custom settings.
2. Enter event information
On the first page of the Event wizard you enter background details about the event, such as a name and detailed
information. (The event name, a time zone, and language are required; all other fields are optional.) You can edit this
information after the event is created.
Note: If you change the event start date to a date in the future, participants and presenters can still enter the meeting room
at any time.
3. Select content
Content for an event must exist before you create an event. After you select a type of content, you cannot change the
content type. You can, however, substitute different content of the same type. For example, if you create an event based
on a seminar, you can later substitute a different seminar for the one you originally used when creating the event.

106
USING ADOBE CONNECT 8
Adobe Connect Events
Last updated 5/14/2013
4. Create registration
You determine the questions that participants must answer on the registration form. The information creates a guest
profile for tracking the participant. There are four required questions, which are preselected on the Create Registration
form: E-mail address, Password, Retype password, and Name. You can select any of the other questions. For events
that include guests outside your organization (for example, people who find your event listing on your organization’s
public website), it’s a good idea to get the company name and URL for screening purposes. For example, if the
applicant works for a competitor, consider denying access. Select the Enable Campaign Tracking option to report on
registrations by campaign source.
5. Customize registration
You have a great deal of flexibility in designing a registration page for an event, including custom multiple-choice,
short-answer, and yes/no questions. You can also change the order of questions and delete questions at any time.
6. Select event participants
For an event limited to registered guests and accepted users, you can select users and groups to be participants or
presenters in your event. These users will be able to log in to the event directly. Uninvited users who have the URL to
the event meeting room can attempt to log in as guests. In this case, as a host, you can grant admission to guests on an
individual basis.
7. E-mail options
The final step in the Event wizard is to send participants e-mail invitations containing the date, time, duration, and
URL of the event. You can send invitations as you create the event, or you can create and send the invitations at a later
time.
More Help topics
“Change an existing event” on page 108
“Best practices for events” on page 104
“Use campaign tracking with an event” on page 117
Preview and modify registration and event pages
You can preview registration and event pages, modify them (for example, by changing their logos), and make them
public.
More Help topics
“Change an existing event” on page 108
“Best practices for events” on page 104
Preview a registration or event page
1 Click the Event Management tab in Connect Central.
2 Navigate to the event and click its name in the list.
3 Next to Participant View, select which page to preview:
• Click Preview event information, login, and registration pages.
• Click Preview event listing page.

107
USING ADOBE CONNECT 8
Adobe Connect Events
Last updated 5/14/2013
4 Click the desired item to preview it.
Make a folder and event listing page public
The event listing page, which can be branded for your organization, displays a list of all upcoming events and displays
the following for each one:
• Event logo
• Event name
• Description (the Event Information text)
• A Register Now button, which takes the user to a registration form
• A More Information button, which takes the user to the event information page; it includes the Detailed
Information text
All events in a single folder appear on one listing page. For example, you can create a folder that contains events
your organization is hosting and then make that folder public so that users can browse the event listings to learn
about upcoming seminars. To create multiple event listing pages, simply create multiple folders.
You can create public or private folders containing events. A public event listing page is one that anyone can view
from the hosted public pages. A private event listing page cannot be viewed publicly; a user must have login rights
to view it. By default, event listing pages are private, but you can make them public.
1 Click the Event Management tab in Connect Central.
2 Navigate to the desired folder.
3 Click Make This Folder Public.
The folder is now public and a URL is listed. The URL can be made available and the event listing page can be viewed
by anyone from the hosted public pages.
Preview an event listing page for a specific folder
1 Click the Event Management tab in Connect Central.
2 Navigate to the folder containing the events whose listing page you want to view.
3 Make the folder public, if necessary. The button above the list of folders and events is a toggle between private and
public. If the button says Make This Folder Public, click the button.
4 Click the URL below Public Event Listing URL For This Folder.
The event information appears exactly as it will appear on the event listing page.
5 To close the preview window, click the Close button in the upper-right corner.
Note: Remember to make this folder private again after you preview the page if you do not want the folder to be publicly
available yet.
Preview the event listing for a single event
1 Click the Event Management tab in Connect Central.
2 Navigate to the event and click its name.
3 Next to Participant View, click Preview event listing page.
The event information appears exactly as it will appear on the event listing page.
4 To close the preview window, click the Close button in the upper-right corner.

108
USING ADOBE CONNECT 8
Adobe Connect Events
Last updated 5/14/2013
Change the logo associated with the event
1 Click the Event Management tab in Connect Central.
2 Navigate to the event and click its name.
3 Do one of the following:
• Click the Edit Information link above the title bar
• Click the Edit link inside the title bar.
4 Click Browse to find a new image file for the event.
5 Select the image file, and click Open.
6 Click Save.
Publish events
When you publish an event, the following events occur:
• All selected e-mail message options become active. For example, if you selected the first option, send e-mail
invitations, the invitations are automatically sent and you can no longer customize them. You can, however, still
customize any other selected e-mail messages. You can also edit the invitation text and then invite more people—
the new text is used.
• The registration form with its associated URL becomes available, and prospective attendees can begin registering
for your event.
1 Click the Event Management tab in Connect Central.
2 Navigate to the event and click its name in the list.
The Event Information page appears. Next to Status the following message appears: “This event has not been published
and listed on your site. E-mails have not been sent.”
3 Click Publish.
A confirmation message appears: “Publishing this event will send e-mail based on your selected mail options.”
4 Click Publish again.
The Event Information page appears with this status message: “This event has been published. E-mail options are
active.” The Publish button disappears.
More Help topics
“Send event invitations” on page 116
“Best practices for events” on page 104
Change an existing event
Before an event occurs, you can change its beginning time, change participant permissions, or make other
modifications.
Check the Current Participants list periodically to check that you have enough licenses for the number of attendees
listed there and that all attendees meet approval criteria.
Also check the most current registration reports, which show information about your attendees and invitees. If you
selected or customized questions to help identify potential participants, you can also view the responses to questions.

109
USING ADOBE CONNECT 8
Adobe Connect Events
Last updated 5/14/2013
More Help topics
“View information about an event” on page 119
“Best practices for events” on page 104
Notify users of a change
If you modify an existing event, for example, by setting a new start time, you can easily notify users by e-mail.
1 Click the Event Management tab in Connect Central.
2 Navigate to the desired folder.
3 Click the name of the event you want to change.
4 Open the E-mail Options page and select Show Reminder When Updates Need To Be Sent.
5 Click Save.
6 Open the Event Information page and scroll to the Status field.
7 Click Edit/Send Notifications, make any necessary changes, and click Send.
Change event information
You can edit the text on the Event Information page for event participants. If you select the e-mail option “Notify users
when event has been updated,” any invitee whom you have previously notified about the event automatically receives
updated information.
Note: If you have sent invitations but did not select the “Notify users when event has been updated” option, you should
do so before changing the profile information, so that potential attendees can be aware of your changes.
1 Click the Event Management tab in Connect Central.
2 Navigate to the desired folder.
3 Click the name of the event you want to change.
4 Do one of the following:
• Click the Edit link next to Event Information.
• Click the Edit Information link.
5 Change any of the following:
• Edit the event name. The name appears in the event list and in reports. This is a required field.
• Edit the event information. The information can be up to 750 characters in length. This text appears on the Event
Information page and in event reports.
• Edit detailed information about the event (up to 1000 characters in length).
• Edit the start time or end time of the event.
• Edit the time zone of the event.
• Edit the logo information. The logo file can be in BMP, GIF, JPG, or PNG format. The best size to use is 100x135
pixels.
• Change the language for the event. Customarily you select the language used by the presenter or the language used
by the majority of event attendees.
• Change the event user policy to add new users as guests or full Connect users.

110
USING ADOBE CONNECT 8
Adobe Connect Events
Last updated 5/14/2013
• Change the option to approve participants after they register for the event. (In general it is best to have this option
selected because it allows you to control who has access to the event.)
6 Save your changes in one of two ways:
• Click Save.
• Click Save And Rebuild. (This option rebuilds HTML pages if you use Adobe Contribute® to build pages.)
Change registration questions
You can change any registration question, except the required questions (first name, last name, e-mail, and password),
which the system uses to validate a user.
1 Click the Event Management tab in Connect Central.
2 Navigate to the desired folder.
3 Click the event you want to change.
4 Click Registration Questions.
5 Modify the registration questions:
• To add a question to the registration page, select the check box to the left of the question and click Save.
• To remove a question from the registration page, deselect the check box to the left of the question and click Save.
6 To modify, delete, or add custom questions, click Customize.
• To change the order of questions in the list, select the check box to the left of the question, and click Shift Up or
Shift Down.
• To delete a question, select the check box to the left of the question and click Remove.
• To modify a custom question, click the question text in the Customize window.
• To add a question, click the button that corresponds to the type of custom question you want to add: New Multiple
Choice, New Short Answer, or New Yes/No.
7 When you finish, click Return To Registration Menu.
Add a multiple-choice question
1 Click the Event Management tab in Connect Central.
2 Navigate to the desired folder.
3 Click the event you want to change.
4 Click Registration Questions.
5 Click Customize.
6 Click New Multiple Choice.
7 In the Question window, type a question in the box.
8 Type a possible answer for Answer 1. You can delete an answer at any time by clicking the Delete button next to it.
9 Click the Add Above or Add Below buttons to add another answer above or below Answer 1; if you click Add
Above, Answer
1 becomes Answer 2.
10 Type another possible answer.
11 Repeat steps for a maximum of four answers.
12 To require that users answer the question, select Response Is Required.

111
USING ADOBE CONNECT 8
Adobe Connect Events
Last updated 5/14/2013
13 Click Save. The Customize Registration window appears, showing your new question.
Add a short-answer question
1 Click the Event Management tab in Connect Central.
2 Navigate to the desired folder.
3 Click the event you want to change.
4 Click Registration Questions.
5 Click Customize.
6 Click New Short Answer.
7 Type a question in the box.
8 To require that users answer the question, select Response Is Required.
9 Click Save. The Customize Registration window appears, showing your new question.
Add a yes/no question
1 Click the Event Management tab in Connect Central.
2 Navigate to the desired folder.
3 Click the event you want to change.
4 Click Registration Questions.
5 Click Customize.
6 Click New Yes/No.
7 Type a question in the box.
8 To require that users answer the question, select Response Is Required.
9 Click Save. The Customize Registration window appears, showing your new question.
Change event content
You can replace event content only with content of the same type, for example, you can replace one meeting with
another. You cannot add any new content to the Content library from here; you can select only existing content for
your event.
In addition, if you purchased Adobe Presenter, you can publish presentations from PowerPoint to the Content library
for your event. If you plan to use an existing presentation for an event, republish the PowerPoint presentation to a
Content library folder other than the one containing the original presentation. If you do not, the reporting information
for the original presentation will be merged with the event-specific report data, and any event-specific data will be
carried over into any future reports for the original presentation.
Note: For content other than courses and curriculum, the system tracks only whether the user has viewed the event. For
example, users who view only the first slide in a presentation are reported as having attended the event. In contrast, users
who view only a few of the slides in a course or curriculum are not reported as having attended; that is, users must
complete and return the course to appear on the report as attendees. (Also, you can view Time In and Time Out
information by viewing the event By Attendee report.)
1 Click the Event Management tab in Connect Central.
2 Navigate to the desired folder.
3 Click the event you want to change.

112
USING ADOBE CONNECT 8
Adobe Connect Events
Last updated 5/14/2013
4 At the top of the Event Information page, click the Select Content link.
5 If the content you want does not appear in the list, navigate to the file or folder where the content that you want
resides:
• Click the appropriate link at the top of the tab (for example, Shared User Content if you are replacing content).
• Scroll to the folder or file that you want and either select the check box to the left of it or click the folder or file, as
appropriate. If you are in the Content library, click Up One Level to navigate to a higher folder directory.
6 Click Save.
Change event e-mail options
You can change e-mail options for any of the e-mail notification, reminders, or follow-up messages before they are
sent. (Some messages are selected by default.)
You can customize an e-mail message. In several types of messages, you can attach a Microsoft Outlook Calendar
(iCal) entry that adds the event to the recipient’s Outlook Calendar.
When you customize an e-mail form, there are several fields in curly brackets ({}) in the Message Body area. In general,
do not change any of the fields, unless you have a specific reason for doing so. The curly brackets contain variables that
the system replaces with actual values that are specific to your event. For example, the event-time field displays the
beginning time you specified. If you want to change that time in the e-mail message, perhaps making it 15 minutes
earlier to ensure that the actual event can begin on time, you can manually type in a new time in the event-time field.
Note: If you choose to add any of the extra run time fields to the e-mail message, please note that {user-email} is the e-mail
address of the event manager, not invited attendees. For the recipient’s login-ID in the event notification, use the {login}
field.
1 Click the Event Management tab in Connect Central.
2 Navigate to the desired folder.
3 Click the event.
4 Click the Email Options link at top of the Events tab. Do any of the following:
• Select the check box to the left of the e-mail messages you want to send.
• Deselect any e-mail messages you do not want to send.
• Click Customize next to any messages that you want to edit. For example, you can change the name of the creator
to the name of the host, or the time to Greenwich Mean Time. (You can edit messages, but do not change any of
the items in curly brackets ({}) on the Edit E-mail page.)
5 Click Save to save your changes or Cancel to exit the e-mail form.
Edit the mailing list
You can add and delete users, groups, and guests from the mailing list.
Note: Each time you create an event, the system creates a group named after the event and populates it with the invited
users. This makes it easy to invite the same people to a follow-up event: in the Users And Groups list, simply select the
group from the previous event.
1 Click the Event Management tab in Connect Central.
2 Navigate to the desired folder.
3 Click the event.
4 Click Participant Management.

113
USING ADOBE CONNECT 8
Adobe Connect Events
Last updated 5/14/2013
5 Edit users or guests:
• Click Add Guest and type or paste in e-mail addresses for all your invitees; use commas to separate the addresses.
• Click Add User/Group and, in the Available Users And Groups list, select each user and/or group that you want to
invite.
• Click Registration Groups and, in the Possible Groups list, select each group you want to invite. (You must be an
account administrator to select event registration groups.)
• Click Import/Export List and then click Browse to navigate to a comma-separated value (CSV) file.
• Click Edit/Send Invitations to customize and send the event invitation. (You can edit the invitation, but do not
change any of the items in curly brackets ({}) in the message body.)
Note: If you choose to add any of the extra run time fields to the e-mail message, please note that {user-email} is the e-mail
address of the event manager, not invited attendees. For the recipient’s login-ID in the event notification, use the {login}
field.
Tips for creating event mailing lists
Keep the following information in mind when you create mailing lists:
• A guest is a Connect user with limited access. Guests can attend only those events for which they are approved. Also,
guests cannot log in to Connect Central.
• A user is a user with a Connect account in your organization.
Note: Before sending out invitations, check with your Connect Central administrator for licensing issues. If more people
register for the event than you have licenses for, attendees may not be able to join the event when they try to log in.
If the number of guests you are planning to invite is limited, you can type or copy and paste their e-mail addresses
using the Add Guest function. If the number is larger, in the hundreds or thousands, you can import a comma-
separated values (CSV) file of users.
If you are inviting Connect users, you can use the Select Participants page to add users to the event invitation list
and assign them permissions.
Finally, after you create the list, you can send out the invitations using default text or a customized invitation.
More Help topics
“Add event participants using a CSV file” on page 115
“Best practices for events” on page 104
Add and manage event participants
You can add or remove participants for an event and change participant or presenter permission settings if you are an
administrator or a presenter for the event. You can add participants to an event at any time after creating an event.
Participants can be added as guests, users, or groups.
More Help topics
“Change an existing event” on page 108
“View information about an event” on page 119

114
USING ADOBE CONNECT 8
Adobe Connect Events
Last updated 5/14/2013
Add guests
1 Click the Event Management tab in Connect Central.
2 Navigate to the desired event and select it.
3 In the Event Information page, click Participant Management in the navigation bar.
4 Click Add Guest.
5 In the box, type or paste the e-mail addresses of the people you want to invite. (Separate e-mail addresses with
commas.)
6 When you finish, click Save.
Add participants
1 Click the Event Management tab in Connect Central.
2 Navigate to the desired event and select it.
3 In the Event Information page, click Participant Management in the navigation bar.
4 Click Add User/Group.
5 In the Available Users And Groups list, select a user or group and click Add. You can also click Search to find a user
or group that is not listed.
As you add users and groups, the Current Participants list on the right is updated to reflect your changes.
Note: Each time you create an event, the system creates a group named after the event and populates it with the invited
users. This makes it easy to invite the same people to a follow-up event: in the Users And Groups list, simply select the
group from the previous event.
6 When you finish, click OK.
Remove participants from an event
1 Click the Event Management tab in Connect Central.
2 Navigate to the desired event and select it.
3 In the Event Information page, click Participant Management in the navigation bar.
4 Select the groups or users that you want to delete from the participants list.
5 Click Remove.
Note: Participants who are removed from the event do not receive an invitation and cannot join the event unless event
access is changed to Anyone.
Change permissions of event participants
1 Select the Event Management tab in Connect Central.
2 Navigate to the desired event and select it.
3 In the Event Information page, click the Participant Management link in the navigation bar.
4 In the Users And Groups list, select the user or group whose permission you want to change.
5 Click Set User Role and, from the pop-up menu, select the new permission type to assign. The permission types are:
Denied, Invited, Pending Approval, Participant, Presenter, and Host. (Presenter and Host are available only if the
event is a meeting or seminar.)

115
USING ADOBE CONNECT 8
Adobe Connect Events
Last updated 5/14/2013
Designate a group for approved event registrants
You can designate a group that event registrants are automatically assigned to when they are approved for the event.
This is useful if you want to conduct a follow-up event because you’ll have all the registered attendees organized into
one group.
Note: You must be an account administrator to select event registration groups.
1 Select the Event Management tab in Connect Central.
2 Navigate to the desired event and select it.
3 Click the Participant Management link in the navigation bar.
4 Click Registration Groups.
5 In the Possible Groups list, select a group and click Add. The selected group name appears in the Current Group
Membership list.
Convert guests to full users
If you are an Administrator, you can convert existing guests to full users. This distinction can be important because
only full users, not guests, can log into the Connect Central administration site. Full users also appear on enrollment
and permission lists.
1 Select the Administration tab in Connect Central.
2 Select Users And Groups.
3 Select Manage Guests.
4 In the Current Guests list, select a guest.
5 Click Convert To User.
Conversely, if you wanted to change a full user into a guest, you would select a user in the Current Users list and then
click Convert to Guest.
Add event participants using a CSV file
If you have a comma-separated values (CSV) file that contains names and e-mail addresses, you can import the CSV
file to add participants to an event. Keep these requirements in mind when you import a CSV file:
• The file should not contain empty lines. If the CSV file contains empty lines, the import operation fails.
• Names that contain a comma must be in quotes. For example, the name John Doe, Jr., must appear in the CSV file
as “John Doe, Jr.” for the file to import correctly.
• Do not include a header row in the CSV file.
• At minimum, the CSV file must contain columns for first name, last name, and e-mail address. For example:
Michael Betts [email protected]
Rachel Blatt [email protected]
Rebecca Bloom [email protected]

116
USING ADOBE CONNECT 8
Adobe Connect Events
Last updated 5/14/2013
Note: Guest users that were imported into a CSV file in Connect Enterprise 5.1 (Breeze 5.1) do not have first and last
name columns, just one name column, so they are exported with the full name in the first name column and a blank in
the last name column.
1 Click the Event Management tab in Connect Central.
2 Navigate to the desired event and select it.
3 In the Event Information page, click Participant Management in the navigation bar.
4 Click Import/Export List.
5 Click Browse, and navigate to the desired CSV file.
6 Click Upload.
More Help topics
“Change an existing event” on page 108
Send event invitations
If you are an administrator, an event host, or a user with permissions to manage a specific Event library folder, you can
send event invitations.
An event invitation is an e-mail message that is sent to event attendees, informing them of the date, time, duration,
and URL of the event. The way that invitations are sent depends on the type of event:
Invitees Only If your event is for registered users only, you create a custom e-mail message in Connect Central. You
can send the e-mail to all registered participants and presenters, presenters only, or participants only. You can
customize the subject and message body. You also have the option to attach a Microsoft Outlook Calendar iCal so that
participants can add the event to their Outlook Calendar.
Anyone If your event is open to anyone who receives the event URL, you can create a new e-mail message in your
default e-mail program. This message contains a pre-populated subject and a pre-populated message (event date, time,
duration, location, and summary), but you can edit the text.
1 Select the Event Management tab in Connect Central.
2 Navigate to the desired event and select it.
3 In the Event Information page, click the Participant Management link in the navigation bar.
4 Click Edit/Send Invitations in the navigation bar.
5 (Optional) If you want to send a blind copy of the invitation to anyone, add the e-mail address in the BCC
Recipients box. This can be useful if, for example, you want coworkers to know that you sent the invitation.
6 Edit the subject and the message body.
If you edit the text, there are several fields in curly brackets ({}). In general, do not change any of the fields, unless you
have a specific reason for doing so. The curly brackets contain variables that the system replaces with actual values that
are specific to your event.
Note: If you choose to add any of the extra run time fields to the e-mail message, please note that {user-email} is the e-mail
address of the event manager, not invited attendees. For the recipient’s login-ID in the event notification, use the {login}
field.
7 To attach an iCal, select the check box next to the Attach Microsoft Outlook Calendar Event (iCal) To E-mail
Message option.
8 Click Send.

117
USING ADOBE CONNECT 8
Adobe Connect Events
Last updated 5/14/2013
More Help topics
“Change an existing event” on page 108
“Preview and modify registration and event pages” on page 106
Use campaign tracking with an event
Use the campaign tracking option to track registered users by campaign source. The Events registration and
attendance reports list campaign sources alongside user names. Common campaigns include e-mail offerings, search
engine campaigns, and banner ad campaigns. To track campaigns, you manually modify the automatically provided
registration URL.
One method of adding campaign tracking is to select the campaign tracking option on the Create Registration page
when creating a new event. You can also add campaign tracking to an existing event if you have not published the event
or sent out invitations. (If you select the campaign tracking option after publishing the event and sending out
invitations, any invitees who already registered using the registration URL sent in your original e-mail invitation will
not be tracked.)
Note: To track a campaign, modify the registration URL for the event. Remember that you can’t change the registration
URL for the Event Listings page and the Event Information page. If you want to use the Event Listing page or the Event
Information page, you cannot track a campaign.
More Help topics
“Creating an event” on page 105
“Change an existing event” on page 108
“Preview and modify registration and event pages” on page 106
Add campaign tracking to an existing event
1 Open Connect Central and click the Event Management tab.
2 Select the event.
3 Click the Registration Questions link.
4 Select the Enable Campaign Tracking option.
5 Click Save.
Add the campaign ID parameter and ID number
1 Open Connect Central and click the Event Management tab.
2 Select the event to display the Event Information page.
3 Click the “Preview event information, login and registration pages” link.
4 Select and copy the registration URL displayed next to “Registration Form.” For example,
http://name.server.com/primetimeevent/event/registration.html.
5 Open a word-processing application, such as Notepad or Wordpad, and paste the registration URL.
6 In the word-processing application, place the insertion point at the end of the URL and type ?campaign-id= (for
example, http://name.server.com/primetimeevent/event/registration.html?campaign-id=).

118
USING ADOBE CONNECT 8
Adobe Connect Events
Last updated 5/14/2013
7 At the end of the new event registration URL, add a campaign tracking ID. The ID is a unique identifier for your
campaign and can be any alphanumeric value. For example,
http://name.server.com/primetimeevent/event/registration.html?campaign-id=email1234 contains the valid
campaign tracking ID “email1234.”
8 Save the text file and leave the text file open in the word-processing application.
Test the URL with campaign tracking ID
To test the new URL, you disable e-mail invitations, publish the event, register for the event, and then check the
registration report.
1 Open Connect Central and click the Event Management tab.
2 Select the event to display the Event Information page.
3 Select E-mail Options.
4 Deselect the Send Event Invitations option.
5 Click Save.
6 At the bottom of the Event Information page, the status message reads, “This event has not been published and
listed on your site. E-mails have not been sent.” Click Publish.
7 A confirmation message appears. Click Publish again. The Event page displays and the status message now reads,
“This event has been published. E-mail options are active.”
8 To test your modified registration URL, register for the event. Open a web browser in a new window.
9 In the word-processing application, copy the modified registration URL (with the campaign ID parameter and
custom campaign ID added). Paste the URL into the new web browser window and press Enter or Return.
10 In the registration form, fill out the required fields using your name and e-mail address.
11 Click Submit.
12 Check your e-mail program for an event confirmation message.
13 Now that you have registered for the event, you can see your name and the campaign tracking ID in the registration
reports. Open Connect Central and click the Event Management tab.
14 Select the event to display the Event Information page.
15 Select Reports.
16 Select By Registrants.
17 In Registration Report, click Download Report Data. In the Excel spreadsheet that opens, check that the correct ID
number appears in the Campaign Tracking ID column next to your name.
Send event invitations with correct registration URL
If you are using Connect Central to send event invitations, manually replace the registration URL automatically
generated in Connect Central with the modified URL.
Note: If you are sending e-mail invitations using third-party software, ensure that you send invitees the new, modified
event registration URL.
1 Open Connect Central and click the Event Management tab.
2 Select the event to display the Event Information page.
3 Select E-mail Options.

119
USING ADOBE CONNECT 8
Adobe Connect Events
Last updated 5/14/2013
4 Select Send Event Invitations.
5 Next to Send Event Invitations, click Customize.
6 In the message body, replace the words “event-registration-url” in the runtime field {event-registration-url} with
the modified registration URL you created. (You can cut and paste the URL from the word-processing program
you used to modify the URL.)
7 Specify a date and time to send the event invitation e-mail.
8 Select Save.
9 If you are also using the Remind Participants Closer To Event e-mail option, you must click Customize next to the
option and follow the instructions in step
6 above to replace the registration URL in the message body.
Managing events
View information about an event
If you are an administrator, an event host, or a user with permissions to manage a specific Event library folder, you can
view different kinds of information about an event from the Connect Central application.
More Help topics
“Change an existing event” on page 108
“Add and manage event participants” on page 113
View a participants list
1 Click the Event Management tab in Connect Central.
2 Navigate to the folder that contains the desired event and select it.
3 In the Event Information page, click the Participant Management link.
The names of registered participants and groups appear.
View an uploaded content list
You can view a list of all content that has been uploaded to Connect Server. To view the content list, you must be an
administrator, an event host, or a user with permissions to manage a specific Event library folder.
1 Click the Event Management tab in Connect Central.
2 Navigate to the folder that contains the desired event and select it.
3 Click the Select Content link.
A list of all uploaded content appears.
Viewing data about events
The Event Dashboard provides a graphical representation of statistical data about your events. To see the Dashboard,
click the Event Dashboard link under the tab bar, at the top of the Event window.
The data reflects all of the events in your My Events folder and appears in one bar graph showing the most active events
over the last six months (determined by the number of sessions). You can click any individual event in the graph to
view more detailed information about the event.

120
USING ADOBE CONNECT 8
Adobe Connect Events
Last updated 5/14/2013
Event reports
The Reports feature of Connect Central lets you create reports that show event statistics from different perspectives.
Event reports use the following definitions:
Invited The number of people invited to the event.
Registered The number of people who completed the registration form and were approved by the event host.
Pending The number of people waiting to be approved to attend the event.
Approved The number of people approved to attend the event. This number includes people who completed the
registration form and were approved. It also includes people who are approved directly, such as event presenters, and
do not need to register.
Denied The number of people who completed the registration form but were denied registration. For example, this
can happen if the registration URL is made public on a website or through e-mail and people register for the event by
mistake.
Attended The number of people who attended the event.
More Help topics
“About Connect Central reports” on page 195
Attending Connect Events
Attending a Connect event is similar to attending a Connect meeting, seminar, or training session. The main difference
is that attendees must register before joining an event.
Joining events
Any Connect Event that you are permitted to join appears in the event list. (To view the event list, navigate to the
Connect Central Home tab, and click My Scheduled Events.)
All Connect Events require registration, although not all require approval. Following are two ways to register for an
event:
• From a link in the e-mail invitation, which applies only if you were invited by the event host.
• From a link in the event listing on the public pages of a website, which applies if the event is open to the public.
After you click the registration link, a form appears. You can use this form to register for the event. (Registered
Connect users must log in before registering for the event.) During registration, you create a guest profile by
entering a password and answering questions. Then, depending on the way the event was created, you might receive
a notification e-mail that provides your status (pending, approved, or denied). If you are approved, the e-mail
message includes the following information:
• URL
• Dial-in telephone number and participant code that you use to phone in, if appropriate
In addition, if you received an e-mail invitation with an iCal attached and you have Microsoft Outlook, you can add
the event to your Outlook Calendar.
If you are a Connect user and the event was created in the same Connect account as yours, the event also appears
in Connect Central under My Scheduled Events.

121
USING ADOBE CONNECT 8
Adobe Connect Events
Last updated 5/14/2013
Note: The event registration form cannot be used to create a new user if you are already logged in as a user. For example,
if you are logged in to a Connect session, you cannot register for an event as a different user.
Enter a scheduled event from Connect Central
1 On the Home tab, click My Calendar.
2 In the calendar, navigate to the date of the event.
3 In the calendar, click the event name.
4 Under Details, find the event you want to enter and click Open.
If you have not registered yet or need approval, you may need to log in, enter your password, and complete the
registration form.

122
Last updated 5/14/2013
Chapter 5: Audio and video conferencing
Audio in meetings
Audio conferencing options
Adobe Connect supports the following solutions for adding audio to meetings and training sessions. Contact your
administrator to find out which audio conferencing options are available for your account.
Built-in VoIP
Adobe Connect broadcasts audio in meetings or training sessions using VoIP and the microphones on attendees’
computer systems. See
“Audio in meetings” on page 122.
Universal voice audio providers
Universal voice audio providers enable Adobe Connect to broadcast all telephone-based audio into a Adobe Connect
meeting room over VoIP. Both account administrators and hosts can configure audio conferencing providers for
universal voice. See
“Using universal voice” on page 123.
Integrated telephony adaptors without universal voice
These adaptors, which are extensions to Adobe Connect written in Java, provide communication between Adobe
Connect and specific audio conferencing providers. Integrated adaptors have advanced call capabilities, allowing hosts
to control the audio conference from the meeting. Adobe provides several integrated telephony adaptors for hosted
installations. For example, MeetingOne, PGi, and InterCall are integrated telephony adaptors. Integrated adaptors in
licensed installations can also be configured for universal voice. See
“Using integrated adaptors” on page 124.
The following table compares the universal voice and integrated telephony solutions.
More Help topics
“Creating and arranging meetings” on page 9
“Starting and attending meetings” on page 14
“Edit meeting information” on page 22
“Creating training curriculums” on page 67
“Creating virtual classrooms” on page 79
Universal Voice Audio Provider Integrated Telephony Adaptor
Broadcast audio in Adobe Connect over VoIP Yes Yes, if enabled for universal voice
Enhanced call control. For example, mute, hold, and
so on.
No Yes
Record audio with Adobe Connect meeting Yes Yes
Requires Flash Media Gateway (bundled in the Adobe
Connect installer)
Yes No

123
USING ADOBE CONNECT 8
Audio and video conferencing
Last updated 5/14/2013
Using universal voice
Workflows for universal voice
The universal voice solution enables you to conduct a live audio conference with meeting participants over VoIP.
Participants hear any telephone-based audio through their computer speakers and can broadcast their voices either via
telephone or computer microphone. Hosts can record the audio conference with the Adobe Connect meeting.
Configure a universal voice audio provider (administrators/hosts)
Administrators configure audio providers for all users of an account. Hosts configure audio providers for their
personal use in audio conferences.
1. Add or edit an audio provider.
You can configure virtually any audio provider to use universal voice functionality, as long as an account exists with
the provider. The first step is to set up identification details, including the name of the provider and telephone numbers
for dialing into the meeting. See
“Create or edit audio providers” on page 170.
2. Add a dialing sequence.
For hosted accounts, the Adobe Connect server uses the dialing sequence to join the audio conference in the
background when the host joins the conference in the meeting room. In this step, you set up the conference number,
DTMF tones, and pauses for dialing into an audio conference. See
“Define a dialing sequence” on page 172.
3. Test the dialing sequence.
To verify that the dialing sequence works as expected, you can execute the steps, including the user-defined steps, and
then adjust the dialing sequence accordingly. See
“Test a dialing sequence” on page 174.
Create and use an audio profile (administrators/hosts)
1. Create an audio profile.
For any audio provider in your account, you can create one or more audio profiles for setting up audio conferences.
See
“Create and use audio profiles” on page 125.
2. Create a meeting and select an audio profile.
You create a meeting using the Meeting wizard, but instead of entering audio conference settings manually, you select
one of your audio profiles. These audio profiles contain the conference settings for the audio provider. See
“Associate
an audio profile with a meeting” on page 126.
Start an audio conference (hosts)
1. Enter the meeting room.
Hosts start the meeting, and participants receive an invitation by e-mail or instant message to join the meeting. See
“Join a meeting” on page 17.
2. Start the audio conference.
From the meeting room, hosts start the audio conference so that Adobe Connect can join the conference. See “Start
meeting audio” on page 127.

124
USING ADOBE CONNECT 8
Audio and video conferencing
Last updated 5/14/2013
3. (Optional) Record the audio conference.
Hosts can record any telephone-based audio along with the web conference. The audio is played back with the audio
conference. See
“Record a meeting” on page 133.
Best practices for starting a universal voice conference
If a host starts an audio conference as a moderator and then leaves the meeting room or is disconnected, the conference
ends for all participants. However, if a host starts the audio conference as a participant and then leaves the meeting
room, the audio conference continues for the remaining participants.
To avoid ending the audio conference if you leave the meeting room, do the following:
1 Create an audio profile that uses a participant code to start the audio conference. See “Create and use audio profiles”
on page 125.
For user-configured providers, make sure that the dialing sequence includes a participant text box. This text box
appears when you create an audio profile based on that provider.
2 Enter the Adobe Connect meeting room, and start the audio conference.
3 Use a telephone to dial into the meeting.
More Help topics
“Audio conferencing options” on page 122
“Define a dialing sequence” on page 172
“Join audio conference” on page 128
Using integrated adaptors
Include attendees in an audio conference call
Hosts have several options for dialing out to include participants in an audio conference call. You can dial out to a
registered participant by using the telephone number stored in their profile or by entering a new telephone number.
To include an unregistered participant in the audio conference call only, you can enter a new name and number to dial.
More Help topics
“Audio conferencing options” on page 122
“Creating and arranging meetings” on page 9
“Starting and attending meetings” on page 14
“Creating training curriculums” on page 67
“Creating virtual classrooms” on page 79
About audio conference status
After attendees connect to an audio conference, status icons appear next to their names.
Note: Status icons do not appear for user-configured audio providers.

125
USING ADOBE CONNECT 8
Audio and video conferencing
Last updated 5/14/2013
Note: Some audio conference providers do not support the On Hold feature.
More Help topics
“Audio conferencing options” on page 122
“Enable microphone for participants using computers” on page 128
Create and use audio profiles
An audio profile is a collection of audio conference settings that map to an audio provider. You use audio profiles
whenever you use an audio provider with a Connect meeting. Audio providers are companies that offer audio
conferencing services that work with Adobe Connect. For more information about audio providers, see
“Audio
conferencing options” on page 122.
Create an audio profile
All audio profiles include the audio provider and profile name. The remaining information includes numbers and
access codes that hosts provide for meetings. The text boxes that appear for entering this information depend on the
provider. For integrated providers, the requested information comes from their configuration code. For universal
voice providers, the requested information comes from host-defined steps in the dialing sequence. See
“Define a
dialing sequence” on page 172.
Note: You can ensure that the audio conference settings and other profile information successfully start an audio
conference. Run the test on the Enter Provider Information page (Administration
> Audio Providers or My Profile > My
Audio Providers, select a provider, and click Edit). See
“Test a dialing sequence” on page 174.
Meeting hosts, limited administrators, and administrators can create audio profiles.
1 In Adobe Connect Central, click My Profile > My Audio Profiles.
2 Click New Profile.
3 Select an audio provider and name the profile.
Provider Audio providers configured for universal voice by an account administrator or host. Selecting a provider
binds the audio profile to the information configured for the provider.
Profile Name A unique name that represents something meaningful to you, such as the purpose of the audio
profile.
If the account administrator or host included a URL for the provider, it appears in the Profile Information window.
This URL can link to an information page with details on how to create the audio profile.
4 Fill in the remaining information and click Save. Saving the profile automatically enables it for use.
Attendee status Icon
On the phone
Talking
Dialing in progress
On hold
Muted

126
USING ADOBE CONNECT 8
Audio and video conferencing
Last updated 5/14/2013
New Audio Profile window with provider-specific information filled in
To enable or disable an existing audio profile, select it in My Audio Profiles, click Edit, change the Profile Status
menu, and click Save.
Edit or delete an audio profile
You can change the profile name, and enable or disable an existing audio profile. You cannot change the audio
provider. You specify a provider only when you create a profile.
1 In Adobe Connect, click My Profile > My Audio Profiles.
2 Select a profile and click Edit.
3 Change the profile name or status and click Save.
4 To delete an audio profile, select it and click Delete.
Associate an audio profile with a meeting
When you associate an audio profile with a meeting, you include the audio conferencing settings defined for the audio
provider.
1 Do one of the following:
• Create a meeting and enter the required information (click Meetings > New Meeting).
• Open an existing meeting and click the Edit Information tab.
2 In the Audio Conference Settings section, select Include This Audio Conference With This Meeting. Select the
profile from the menu and click Save.
All the profiles you created appear in the menu.
Note: If you change the audio profile once you start the meeting, the new conference settings take place only after you end
and restart the meeting. Wait for a few minutes to see the changes.

127
USING ADOBE CONNECT 8
Audio and video conferencing
Last updated 5/14/2013
Selecting an audio profile for a meeting
Enable audio in meetings
Start meeting audio
Audio for meetings is not enabled by default. To start an audio conference, do the following:
1 Navigate to the Meeting Information page for a specific meeting.
2 Click Enter Meeting Room.
3 From the Audio menu, choose one of the following:
Microphone Rights for Participants This option appears if there is no audio profile attached to the meeting. Choose
this option to enable audio conference using VoIP.
Start Meeting Audio This option appears if an audio profile is attached to the meeting.
4 Specify how you want the attendees to join the meeting’s audio conference. You can specify one or more of the
following. The availability of the options depend on the meeting’s audio and system configuration.
Using Computers Choose this option if you want attendees to join the audio conference using their computer speaker
and microphone (VoIP). All users can hear meeting audio using the computer’s speakers. To enable Participants to
speak, click Enable Microphone Rights for Participants.
Using Phone Choose this option if you want attendees to join the audio conference over the telephone. Users can dial-
in to the audio conference or receive a call from the meeting. Click Start Broadcasting Telephony Audio to enable
attendees using computers to interact with attendees on phones.
Note: If Universal Voice is configured, you can select both options. Participants can join the audio conference either using
their computer’s microphones, or join the meeting using their phone. Start broadcasting to enable participants to hear
any telephone-based audio through the computer speakers and broadcast their voices to telephone users using the
microphone. When you stop broadcasting, VoIP users will be audible to phone users, but phone users will not be audible
to the meeting users.
5 Click Start.
Once meeting audio has been started, attendees need to join the audio conference.

128
USING ADOBE CONNECT 8
Audio and video conferencing
Last updated 5/14/2013
Join audio conference
After a host starts an audio conference, a notification window appears to all attendees. They can then broadcast their
voices via their telephones or computer microphones.
1 To connect to conference audio, click the telephone button in the main menu bar.
2 In the Join Audio Conference dialog box, select one of the following:
Dial-out Receive a call from the meeting on the telephone number you enter.
Dial-In Place a call via telephone using the number and instructions provided in the text box.
If a dial-in token is provided, hosts can mute specific attendees. Without a dial-in token, hosts must first merge
attendees with the related phone number in the Attendees pod. (See
“Merge two listings for the same caller in a
conference call” on page 129.)
Using Computer To connect using your computer microphone and speakers. (See “Broadcast your voice using
VoIP” on page 129.)
More Help topics
“Start meeting audio” on page 127
“Audio conferencing options” on page 122
Manage audio within meetings
Enable microphone for participants using computers
By default, only hosts and presenters can broadcast audio using their microphones. However, hosts can enable
participants to broadcast by doing any of the following:
• To enable audio for all participants, choose Audio > Microphone Rights For Participants. icon displays for all
participants in the Attendees pod.
• To enable audio for specific participants, select one or more in the Attendees pod. Then choose any of the following
from the pop-up menu: Enable Audio, Make Host, or Make Presenter.
icon icon displays next to the participant
in the Attendees pod.
Using the same pop-up menu, hosts can later disable audio for specific attendees, reducing background noise.
Allow only one speaker to use the microphone at a time
Hosts can avoid overlapping conversations by doing the following:
❖ Choose Audio > Enable Single Speaker Mode.
An asterisk appears next to the microphone button in the main menu bar. When one speaker clicks the button,
it’s disabled for other users until the current speaker clicks the button again.
Enable Lecture Mode (MeetingOne only)
In MeetingOne audio conferences, you can enable Lecture mode. In the Lecture Mode, only the MeetingOne host, and
Connect hosts and presenters can speak. All other attendees in the meeting are unable to transmit audio as they are
muted or microphone rights are suspended.
❖ Choose Audio > Enable Lecture Mode.

129
USING ADOBE CONNECT 8
Audio and video conferencing
Last updated 5/14/2013
Broadcast your voice using VoIP
1 In the main menu bar, click the microphone button .
As you speak, sound waves appear in the button icon, indicating audio level.
2 (Optional) To the right of the microphone button, click the menu button , and choose Adjust Mic Volume if you
are too loud or quiet. Or choose Mute My Mic to temporarily stop broadcasting (for a cough or other interruption).
When an attendee is broadcasting audio, the microphone icon is displayed next to their name in the Attendees pod.
Adjust or mute audio volume
Each attendee can customize audio volume on their system.
❖ In the main menu bar, select any of the following from the speaker menu :
Mute My Speakers Entirely disables or enables audio. (Click the speaker icon to quickly toggle this option.)
Mute Conference Audio Only Retains any audio playing in the Share and Video Telephony pods.
Adjust Speaker Volume Displays a slider attendees drag to customize volume.
Call out to a new telephone user
1 Choose Audio > Call a New User.
2 Enter the participant’s name and telephone number.
3 Select Call to dial the participant’s phone number immediately.
The attendee is called on the phone and the Call in Progress icon is displayed to the right of the attendee’s name.
Call out to a participant logged in to Adobe Connect
1 In the Attendees pod, select the name of the participant to add to the audio conference.
2 From the pod menu , choose Call Selected User.
The Call Telephone User dialog box appears. You can either enter a new phone number or select a number from the
list of numbers associated with the participant.
3 Click Call.
Merge two listings for the same caller in a conference call
If an attendee dials into an audio conference without a token, they appear twice in the Attendees list: once with their
name, and a second time with their phone number. Hosts can merge the listings into one.
1 In the Attendees pod, do one of the following:
• Drag a number and drop it on the name of the participant.
• Select a particiapant name and the number and choose Merge from the menu.
• Select a particiapant name and the number and from the pod menu , select Merge Users.
2 Click the confirmation button. To hide this button in the future, check Don’t Ask Again.
Note: For audio conference features to function in your meeting or training session, the conference adapter must be
enabled.

130
USING ADOBE CONNECT 8
Audio and video conferencing
Last updated 5/14/2013
Temporarily stop broadcasting audio
During longer meeting breaks, hosts may want to stop broacasting audio.
❖ Choose Audio > Stop Audio Broadcast. To resume, choose Audio > Start Audio Broadcast.
Note: Hosts can stop a broadcast for all attendees, but not for a specific participant.
Stop an audio conference or change audio mode
Do one of the following.
• Choose Audio > Stop Meeting Audio.
• Choose Audio > Change Meeting Audio Mode.
See
“Best practices for starting a universal voice conference
” on page 124 to avoid ending a conference when hosts leave.
Adjust audio quality
Quickly optimize settings with the Audio Setup Wizard
1 Select Meeting > Audio Setup Wizard.
2 Follow the onscreen instructions to optimize audio quality. If a dialog box appears requesting access to your camera
and microphone, click Allow.
Set advanced audio options
1 Choose Meeting > Preferences, and then click Audio in the left pane.
2 Select Use Enhanced Audio to automatically cancel echoes, control microphone volume, and suppress noise.
Deselect this option if you have trouble with audio quality.
3 For Acoustic Echo Cancellation Mode, select one of the following:
Note: The Adobe Connect Add-in must be installed to use these options.
Full Duplex Enables multiple users to speak at one time. If echo feedback results, select another option (this option is
preferred for most systems).
Half Duplex Enables only one user to speak at a time. Use this option if microphones on your system are unusually
sensitive (transmitting unwanted background sound) or if you have poor echo cancellation.
Headphones Optimizes audio settings for use with headphones. This option uses Full Duplex mode, in which multiple
users can speak at one time.
Off Disables echo cancellation.
4 Select Automatic Gain Control to enable your microphone volume to adjust automatically in response to changes
in voice level. Deselect this option if audio volume fluctuates unpredictably.
5 For Audio Quality, choose the highest setting that does not degrade sound:
Fast Provides the fastest performance but the lowest audio quality. (Use this option for systems with slower CPUs.)
Best Provides the slowest performance but the best audio quality. (Use this option for systems with fast CPUs.)
Custom Enables you to select options for audio quality settings. Use this option if the standard settings do not provide
adequate results. Choose from the following options:
• For Echo Path, select 128 (the default setting) or 256. The higher setting provides greater suppression of audio
feedback. This setting uses more CPU resources and is recommended for systems that don’t use headphones.

131
USING ADOBE CONNECT 8
Audio and video conferencing
Last updated 5/14/2013
• Select Noise Suppression to reduce the amount of noise that the microphone picks up. Deselect this option to make
the microphone more sensitive.
• Select Non Linear Processing (selected by default) to use non-linear processing for audio data. Deselect the option
to use standard processing (and fewer CPU resources).
6 Select Use Speex Codec to take advantage of this VOIP-optimized technology. (This option requires attendees to
install the Adobe Connect Add-in.) Options range from Fast for fastest performance and poorest quality, to Best
for slowest performance and best quality.
Video in meetings
Note: Adobe Connect administrators can change pod, audio, and video settings to adhere to standards for governance.
For more information, see
“Working with compliance and control settings” on page 163.
Connect to video telephony streams
The Video Telephony pod lets hosts share video streams with attendees, including any audio. When one-way
communication is sufficient for a presentation, a telephony stream can be preferable to a two-way conference.
1 Choose Pods > Video Telephony.
2 Click Open Stream.
3 From the pop-up menu, choose the appropriate device.
The list of available devices is established by your Adobe Connect administrator. (See “Configure video telephony
devices” on page 174.)
4 Click Connect.
The Video Telephony pod appears for all attendees. When attendees hover the mouse over the pod, a volume
control appears for stream audio.
To display volume control, hover the mouse over Video Telephony pod.
5 In the upper right of the pod, hosts can click Pause Stream, or click the pod menu to access Close Stream,
Change Stream, or Mute Audio options.

132
USING ADOBE CONNECT 8
Audio and video conferencing
Last updated 5/14/2013
Enable participants to share webcam video
By default, only hosts and presenters can broadcast video. However, hosts can enable participants to broadcast by
doing any of the following:
• To enable video for all participants, click the menu button to the right of the microphone button, and choose
Enable Video for Participants.
• To enable video for specific participants, select one or more in the Attendees pod. Then choose any of the following
from the pop-up menu: Enable Video, Make Host, or Make Presenter.
Share webcam video
Hosts, presenters, and participants with enhanced rights can simultaneously share video from webcams connected to
their computers.
Adjust video quality
If you are a host, presenter, or participant with video rights, you can adjust the quality of your webcam video.
1 In the upper right of the Video pod, click the menu icon , and choose Preferences.
2 Adjust the Video Quality setting to optimize the tradeoff between image quality and bandwidth usage. For example,
if shared screens update slowly, choose a lower Video Quality setting.
This setting interacts with the meeting room bandwidth set by the host. (See “Set meeting room bandwidth” on
page 15.)
Share your video
1 Click the Start My Webcam button in the main menu bar or Video pod.
In the Video pod, a preview image appears so you can adjust camera position. If you want to use a different connected
camera, select it from the Video pod menu
.
To cancel video sharing, click outside the preview image in the Video pod.
2 Click Start Sharing to broadcast your video to all participants.
3 To pause or stop video, hover the mouse over Video pod, and click the Pause or Stop icons.
When video is paused, the last image broadcast from your camera remains static in the Video pod until you click Play
to resume broadcasting. When video is stopped, the broadcast image disappears entirely.
Hosts can pause or stop video from any attendee.
Stop (A) and Pause (B) icons in the Video pod
A
B

133
USING ADOBE CONNECT 8
Audio and video conferencing
Last updated 5/14/2013
Recording and playing back meetings
About recording meetings
A host can record a meeting or training session. When played back, the recording shows exactly what the attendees
saw and heard. Everything that happens in the room is recorded, except for the Presenter Only area and breakout
rooms. You can start and stop recording at any time, so you decide what content to record. A host can create a
reference archive of meetings and make the recordings available to attendees.
When you record a meeting, consider the following:
• If you use VoIP and the Video pod to broadcast audio to meeting attendees, all audio is recorded automatically.
• If you use the universal voice solution, you record the audio with the meeting. All telephone-based audio is
recorded, and can be played back with the audio conference.
• If you do not use universal voice, you can use your speakerphone and your computer microphone as recording
devices. All audio input to your computer is captured and recorded but is not broadcast to participants. (Because
audio is not directly integrated with the meeting in this case, the quality can be lower than using a direct method.)
• If you use an integrated telephony adaptor, begin your recording from within Adobe Connect, not from a telephone
key command.
• The meeting recording is assigned a URL and added to the Recordings page associated with the meeting room in
Adobe Connect Central. To play a recording, you need an Internet connection, the recording URL, and permission
to view it.
Note: Adobe Connect administrators can change recording settings to adhere to standards for governance. These settings
affect how meetings and training sessions are recorded and what is recorded. For more information, see
“Working with
compliance and control settings” on page 163.
More Help topics
“Edit a recorded meeting” on page 134
“Create an offline recording” on page 135
Record a meeting
Start recording a meeting
1 If you have associated a universal voice audio profile with the meeting, choose Audio > Join Audio Conference.
2 Choose Meeting > Record Meeting.
3 In the Record Meeting dialog box, enter a name and summary for the meeting recording.
A recording icon (red circle) appears in the menu bar to indicate that the meeting is being recorded.
Note: If a problem occurs during the recording, an error message appears in the upper-right corner of the window. You
can try to reconnect to the conference audio, record the meeting without audio, or stop recording the meeting.
Stop recording a meeting
❖ From the Meeting menu, deselect Record Meeting.
The meeting recording is saved and is available for playback at any time.

134
USING ADOBE CONNECT 8
Audio and video conferencing
Last updated 5/14/2013
About editing meeting recordings
After recording a meeting or training session, you can use the built-in editor to remove sections of the recording. This
is useful if the recording contains periods of silence or unnecessary information. Following are some tips for editing
recordings:
• To edit a meeting or virtual classroom recording in the Content library, you must have Manage or higher
permissions for the recording. (If you created the meeting or virtual classroom, you have these rights by default.)
To edit a recording under Meeting
> Recordings or Training > Recordings, you must have Host permissions.
• After editing a recording, the last edited version is saved and includes all information from earlier editing sessions.
The link to your recording does not change after editing. Users given the link and rights to access the recording see
the most recent version saved, including any edits that were made.
• Multiple users can open a recording in edit mode at the same time. However, after one user saves their changes,
others editing at the same time receive an error when they try to save their changes.
Note: Adobe Connect administrators can change recording settings to adhere to standards for governance. These settings
affect how meetings and training sessions are recorded and what is recorded. For more information, see
“Working with
compliance and control settings” on page 163.
More Help topics
“Record a meeting” on page 133
“Create an offline recording” on page 135
“Working with content in the Content library” on page 144
Edit a recorded meeting
Editing a recording is useful if the recording contains sections of silence or unnecessary information that you want to
remove before making the recording available.
1 From the Adobe Connect Central home page, click Meetings or Training, and then click the meeting or classroom
that includes the recording.
2 Click Recordings.
3 Click Edit next to the recording that you want to edit.
4 Simply click the Play button to watch the recording from the beginning, or first drag the progress marker to a
specific location.
Controls for recorded meetings
A. Play button B. Progress marker C. Selection markers surrounding selection D. Cut E. Undo F. Save
5 Use the selection markers to specify the areas of the recording you want to remove, and click the Cut button.
6 (Optional) At the left of the meeting window, click the triangle to show the Events Index pane, where you can
“Navigate to specific events in recordings” on page 137.
7 (Optional) To remove changes, click Undo to remove individual edits made you last saved, or Revert to Original to
restore the recording to its original state.
8 Remove any additional sections. When you are finished, click Save.
A B
C D E F

135
USING ADOBE CONNECT 8
Audio and video conferencing
Last updated 5/14/2013
Note: Adobe Connect administrators can change recording settings to adhere to standards for governance. These settings
affect how meetings and training sessions are recorded and what is recorded. For more information, see
“Working with
compliance and control settings” on page 163.
More Help topics
“Record a meeting” on page 133
“Create an offline recording” on page 135
“Working with content in the Content library” on page 144
Create an offline recording
If you want people who do not have access to an Adobe Connect server to view a meeting recording, create an offline
version. The offline recording is saved as an FLV file, which can be viewed in an FLV player, and distributed via e-mail,
CD, or a server.
Note: Creating an offline recording takes approximately the same amount of time as the duration of the original meeting
recording.
You can minimize the offline recording window or view other windows on top of it without interfering with the
contents of your recording.
1 From the Adobe Connect Central home page, click Meetings or Training, and then click the meeting or classroom
that includes the recording.
2 Click Recordings.
3 Next to the specific recording you want to use, click Make Offline.
4 If Help text appears, click Proceed with Offline Recording. Then specify a location for the finished FLV file.
The meeting begins playing, creating the offline file.
5 As needed, click the Pause/Resume, Stop And Save, and Start New controls:
• The Pause/Resume button temporarily stops creation of the offline recording. This can be useful if you must
download a large file and do not want to strain system resources. When you click Resume, the recording continues
from where it was paused. The finished recording is one continuous file regardless of how many times you paused
and resumed recording.
• The Stop and Save button ends the creation of a recording, which is useful if you want to record portions of a
meeting as separate files. Click Start New to resume recording where you left off.
6 When the recording process finishes, close the offline recorder window. (If the window is minimized, it closes
automatically.)
Note: Adobe Connect administrators can change recording settings to adhere to standards for governance. These settings
affect how meetings and training sessions are recorded and what is recorded. For more information, see
“Working with
compliance and control settings” on page 163.
More Help topics
“Record a meeting” on page 133
“Edit a recorded meeting” on page 134
“Working with content in the Content library” on page 144

136
USING ADOBE CONNECT 8
Audio and video conferencing
Last updated 5/14/2013
Play back a recorded meeting
A host or presenter makes the recording URL available so attendees can play the recording. Every recording is
automatically assigned a unique URL and is stored on the Recordings tab for the meeting room in Adobe Connect
Central.
When you play a recording, a recording navigation bar appears in a space below the meeting room. For optimal
performance, a high-speed Internet connection is recommended for recording playback.
Recording navigation bar
A. Pause/Play toggle button B. Progress marker C. Elapsed/total time
You control who has access to the recording:
• Any user invited to the meeting using the invitees or enrollees tabs in Adobe Connect Central can view the
recording if given the recording URL.
• Any user invited to the meeting as a host can see information such as permissions, if they have rights to browse to
the Adobe Connect Central folder where the recording is stored.
• Anyone with Internet access can view the recording if you make it public. Alternatively, you can move the recording
to the Content Library and set specific user permissions (moving the recording to the Content Library is
irreversible.)
Note: Adobe Connect administrators can change pod, sharing, and other settings to adhere to standards for governance.
These settings affect the layout of meeting rooms and what you can do in meeting rooms. For more information, see
“Working with compliance and control settings” on page 163.
More Help topics
“Record a meeting” on page 133
“Working with content in the Content library” on page 144
Play a recording from Adobe Connect Central (hosts and presenters)
1 From the Adobe Connect Central home page, click Meetings or Training, and then click the meeting or classroom
that includes the recording.
2 Click the Recordings option.
3 Click the name of the recording.
4 Do one of the following:
• To view the last edited version of the recording, click the URL For Viewing.
• To view the full, original, unedited version of the recording, click View Original.
You either view the original version of the recording or the latest edited version; multiple edited versions of the
recording are not saved. (If the recording was never edited, the URL For Viewing is the same as View Original.)
Play a recording from a URL (attendees)
Hosts and presenters most often tell attendees about a recording by sending an e-mail message containing a URL link
to the recording.
❖ Click the recording URL that the presenter sent to you.
A B C

137
USING ADOBE CONNECT 8
Audio and video conferencing
Last updated 5/14/2013
The recording opens in your browser and is ready for playback. If you are unable to open the recording, you may not
have been granted rights to access the recording.
Navigate to specific events in recordings
For each meeting recording, a new indexed event is created for every chat message, layout change, slide change, and
camera start or stop. Each event is listed in an Events Index, followed by a timestamp. You can filter and search the
index to quickly navigate to specific events.
1 At the left of the window for the recorded meeting, click the triangle to show the Events Index pane.
Events Index pane (click triangle to show and hide)
2 Do either of the following:
• Click the Filter pop-up menu to select specific events to view. You can show all events, a single event, event types,
or any combination of events that can be indexed. Events that can be filtered include layout changes, chat messages,
slide changes, and users joining or leaving the Attendees or Video pod.
• Search for specific events: type keywords into the search box and click Find. All events that contain a match appear
highlighted. You can search for the following: names of meeting participants, text in all Notes pods, text in all Chat
pods, and text on slides shown in the meeting.
More Help topics
“Edit a recorded meeting” on page 134
Managing recorded meetings
You can view all recordings made for a particular meeting, change permissions, rename, or move a recording, or view
a content report for a recording. Also, a recorded meeting can be used as content for another meeting. (If a recording
has been edited, edits are preserved if the recording is moved to the Content library.)
Note: Adobe Connect administrators can change pod, sharing, and other settings to adhere to standards for governance.
These settings affect the layout of meeting rooms and what you can do in meeting rooms. For more information, see
“Working with compliance and control settings” on page 163.

138
USING ADOBE CONNECT 8
Audio and video conferencing
Last updated 5/14/2013
More Help topics
“Record a meeting” on page 133
“Working with content in the Content library” on page 144
View a list of recorded meetings
If you are an administrator or have Manage permissions for a meeting folder, you can view a list of all recordings that
have been created from a meeting
room.
1 Click the Meetings tab at the top of the Adobe Connect Central home page.
2 If there is more than one meeting folder, navigate to the folder that contains the meeting.
3 Click the meeting name in the list.
4 In the Meeting Information page, click the Recordings link on the navigation bar.
Navigating to the Recordings link
Move recordings to the Content library
To move recordings associated with a meeting in a Meetings library folder to the Content library, you must be an
administrator or a user with permissions to manage that specific Meetings library folder.
Moving a meeting recording to the Content library is useful if you want to give access to people other than the original
invitees.
Note: To make a recording available to anyone in the world that is given the recording URL, see “Play back a recorded
meeting” on page 136.
1 Click the Meetings tab at the top of the Adobe Connect Central home page.
2 Navigate to the meeting that has recordings you want to move.
3 Click the meeting name in the list.
4 In the Meeting Information page, click the Recordings link on the navigation bar.
5 Select the check box to the left of any recording that you want to move.
6 Click Move To Folder on the navigation bar.
7 Navigate to the folder in the Content library where you want to move the recording. (As you navigate, the new
destination appears in the upper right of the Adobe Connect Central window.)
8 Click Move.

139
USING ADOBE CONNECT 8
Audio and video conferencing
Last updated 5/14/2013
Edit recording information
1 From the Adobe Connect Central home page, click Meetings or Training. Then click the meeting or classroom that
includes the recording.
2 Click the Recordings option.
3 Click the name of the recording.
4 In the Recording Information bar, click Edit.
5 Revise the title, summary, and language as desired.
6 To let Adobe Connect Desktop users download the recording locally, select Allow Users To Download Copy To
Local Device.
7 To update any items linked to the recording with the revised information, select Update Information For Any Items
Linked To This Item.
Delete a meeting recording
To delete a meeting recording associated with a meeting, you must be an administrator or a user with permissions to
manage that specific Meetings library folder. When you do delete a recording, you are deleting it from the Meetings
library.
Note: This process does not delete the recording from the Content library if you moved it there previously. To delete a
meeting recording you moved to the Content library, see
“Delete a file or folder” on page 143.
1 Click the Meetings tab at the top of the Adobe Connect Central home page.
2 Navigate to the meeting that has recordings you want to delete.
3 Click the meeting name in the list.
4 In the Meeting Information page, click the Recordings link on the navigation bar.
5 On the Recordings page, select the check box to the left of any recording you want to delete.
6 Click Delete above the list.
7 Click Delete on the confirmation page.
Adobe Connect Webcast
Adobe Connect Webcast is designed to support one-to-many and few-to-many communication with large, dispersed
audiences. These events can be conducted for marketing programs, internal and external communication initiatives,
and continuing education applications. Each event can be customized based on the feature and branding requirements
of the event host or sponsor.
The Adobe Connect Webcast interface provides access to the live event, including audio or video streaming and
presentation content. Access to the webcast is typically provided through a registration URL. Registered attendees have
access to the live event and on-demand replay (which remains associated with the same URL as the live event). Typical
webcasts can include the following attendee features:
• Submit question box
• Refer a friend hyperlinks
• Additional content download options
• Poll questions and surveys

140
USING ADOBE CONNECT 8
Audio and video conferencing
Last updated 5/14/2013
• Option to participate by conference call
Audio and video communication is typically one way in Adobe Connect Webcast. Hosts and moderators present audio
or video content to the audience. The question submission and polling features enable attendees to provide feedback
on the event content. These events also provide robust reporting capabilities to webcast hosts to indicate attendee
engagement, and whether any questions submitted during an event require follow-up.
Each webcast can have a different appearance, depending on the nature of the event and the customer’s needs. To
access an Adobe Connect Webcast, attendees must have Adobe Flash Player 10 or higher, a browser, and Internet
connectivity.
For more information, see www.adobe.com/go/learn_on24_webcast_en.

141
Last updated 5/14/2013
Chapter 6: Managing content
Adobe Connect Central has four libraries: Content, Training, Meetings, and Event Management. The Content library
holds content that you use in meeting rooms and virtual classrooms. Content includes presentations, SWF files, image
files, audio files, video files, and so on. The Training library holds Curriculums, Courses, and Virtual Classrooms. The
Meetings library holds meeting rooms. The Event Management library holds events.
Working with library files and folders
Administrator, limited administrators, and users with Manage permissions can create and navigate folder hierarchies
in libraries. Use these hierarchies to organize content in the libraries.
Administrators, limited administrators, and users with Manage permissions can also set permissions to determine
what tasks each user can perform in the libraries. For example, a manager could set up a folder for each department
and assign Manage permissions to each department chairperson.
More Help topics
“Libraries” on page 187
“Setting permissions for library files and folders” on page 187
Create a folder
Administrators, limited administrators, and users with manage permission for a specific folder can create subfolders
within it.
Note: Administrators set permissions for limited administrators on the Administration > Users and Groups section of
Adobe Connect Central. By default, limited administrators can set permissions for content, but an administrator could
choose to revoke this ability.
1 Click Content, Training, Meetings, or Event Management at the top of the Adobe Connect Central window.
Note: No one can create a folder in the Seminars library.
2 Navigate to the location where you want to add the new folder.
3 Click New Folder on the menu bar above the folder list.
4 Enter the name of the new folder on the new page that appears.
5 (Optional) In Summary, enter information about the new folder.
6 Click Save to create the folder.
More Help topics
“Delete a file or folder” on page 143
“Edit file or folder information” on page 143

142
USING ADOBE CONNECT 8
Managing content
Last updated 5/14/2013
Open a folder
1 Click Content, Training, Meetings, Seminar Room, or Event Management at the top of the Adobe Connect Central
window.
2 Click the name of the folder.
The folders and files within that folder appear. The name of the selected directory appears in the navigation links at
the top of the browser window.
More Help topics
“Delete a file or folder” on page 143
“Edit file or folder information” on page 143
Move a file or folder
You can move a folder or a file in a library. When you move a folder, all of the items within the folder also move to the
new location. You can move folders and files in the Content, Training, Meetings, or Event Management libraries using
the Move button. You can move folders and files in these libraries and in the Seminar Rooms libraries using the Up
One Level button. In Seminar Rooms libraries, you can choose to move uploaded content or recordings that are saved
with a seminar.
1 Click Content, Training, Meetings, Seminar Room, or Event Management at the top of the Adobe Connect Central
window.
2 Navigate to the folder or file that you want to move.
3 Select the check box to the left of the item that you want to move. For a seminar, choose Uploaded Content or
Recordings if you want to move either of those types of items saved with the seminar.
4 Do either of the following:
• Click Up One Level to move the item up one level in the library folder directory.
• Click Move (this option is not available for the Seminar Rooms tab). Select a folder in the folder directory tree, or
click Up One Level. Click Move and then click OK to apply the change.
More Help topics
“Delete a file or folder” on page 143
“Edit file or folder information” on page 143
Move up a level in the folder hierarchy
❖ Click the Up One Level button on the navigation bar above the folder list.
The folders and files within the parent folder appear. The name and location of the parent folder appear in the
navigation links list at the top of the browser window.
More Help topics
“Delete a file or folder” on page 143
“Edit file or folder information” on page 143

143
USING ADOBE CONNECT 8
Managing content
Last updated 5/14/2013
Return to a folder
Above the functional links is a list of navigation links called the navigation trail, which indicates your current location
in the directory structure. You can move to any parent (higher) folder shown in the navigation trail.
❖ Click the name of a parent folder in the navigation trail.
The folders and files in the higher parent directory appear. The name and location of the parent folder appear in the
navigation links at the top of the browser window.
More Help topics
“Move a file or folder” on page 142
“Edit file or folder information” on page 143
Delete a file or folder
When you delete a library folder or file, it is permanently removed from the library and cannot be retrieved. Be careful
to delete only those items you do not need. If you delete items from the Content library that are linked to meetings,
events, seminars, or courses, the deleted content is unavailable from them. When you delete an item, Adobe Connect
Central indicates whether the item is linked and allows you to cancel the deletion. In Seminar Rooms libraries, you can
choose to delete uploaded content or recordings that are saved with a seminar.
Note: For the Training library, if you delete a training folder containing a course that was part of a curriculum, the
deleted course is still listed on the Curriculum information page as a course item. However, the course is no longer
available.
1 Click Content, Training, Meetings, Seminar Room, or Event Management at the top of the Adobe Connect Central
window.
2 Navigate to the folder or file.
3 Select the check box to the left of the item that you want to delete. For a seminar, choose Uploaded Content or
Recordings if you want to delete either of those types of items saved with the seminar.
4 Click Delete on the menu bar above the content list.
5 Click Delete again to permanently delete the selected items, or click Cancel to cancel the deletion.
More Help topics
“Move a file or folder” on page 142
Edit file or folder information
You can edit the title or name of a library item and other information, using the Edit Information button.
Note: If you are editing a Seminar library folder, you can view information about the Seminar license for that folder to
see how many users and meetings are available for a specific Seminar folder. In the navigation bar next to the Editor
Information link, click License Info. Information that appears includes title, summary, start date, end date, number of
concurrent users, and number of concurrent meetings.
1 Click the Content, Training, Meetings, Seminar Room, or Event Management tab at the top of the Connect Central
window.
2 Navigate to the folder or file.
3 Click on the folder or file.

144
USING ADOBE CONNECT 8
Managing content
Last updated 5/14/2013
4 Click the Edit Information link in the navigation bar below the navigation trail.
5 Edit the title, name, or other properties that you want to change.
6 Click Save.
More Help topics
“Open a folder” on page 142
“Move a file or folder” on page 142
Edit seminar folder names or descriptions
1 Click the Seminar Rooms tab at the top of the Adobe Connect Central window.
2 Navigate to the folder and click its name.
3 Click the Edit Information link above the seminar list.
4 Enter a new name for the folder and, if desired, a description in the Summary text input box.
5 Click Save.
More Help topics
“Creating and managing seminars” on page 96
Working with content in the Content library
Content library supported file types
All content in the Content library must be one of the following types:
• A single PDF file
• A single PPT or PPTX file
• A single SWF file
• A single HTML file
• A single Adobe Captivate SWF file
• Adobe Captivate content published through the Adobe Captivate application
• Adobe Presenter content published through the Presenter plug-in
• Presenter content packaged as a ZIP file
• A ZIP file that contains multiple SWF files and extra files (images, XML files, and so on) and a file called index.swf
that is loaded first
• A ZIP file that contains multiple HTM or HTML files and extra files (images, SWF files, and so on) and one file
called index.htm or index.html
• A ZIP file that contains a single PDF file.
• An FLV file
• A single image (JPEG, GIF, or PNG)
• A single audio file (mp3)

145
USING ADOBE CONNECT 8
Managing content
Last updated 5/14/2013
• A single video file (mp4, f4v)
More Help topics
“View content” on page 148
“View data about all content” on page 149
Upload content
Only members of the built-in Authors group with Publish permissions for a specific Content library folder can upload
files to that folder.
You can upload new versions of content that exists in the Content library.
Note: If you have Adobe Presenter or Adobe Captivate installed, you can also use the Publish option within those
applications to upload content to the Content library. You can also upload content from a Meeting room.
More Help topics
“View content” on page 148
“View data about all content” on page 149
Upload files to the Content library
1 In Adobe Connect Central, do either of the following:
• On the Home tab, select Content from the Create New bar.
• On the Content tab, click the New Content button.
2 Under Select Content File, click Browse to locate the file, click its name, and then click Open.
3 Enter a title for the new content file (required) and a summary (optional) in the Enter Content Information text
boxes.
4 (Optional) Enter a custom URL (if you do not assign a custom URL, the system automatically assigns one).
5 (Optional) In Summary, enter information about the new content.
6 Click Save.
The file is uploaded to the server and appears in the content folder.
Note: If you attempt to upload a file of an unsupported file type, the Enter Content page reappears with the message
“Invalid file format selected.”
Upload a new version of a file to the Content library
1 On the Home tab, click Content.
2 In the Content List, click the content file you want to update.
3 Click Upload Content.
4 Click Browse to locate a file in the format specified in the message, click the name of the file, and then click Open.
5 Click Save.
The new version of the content is upload to the Content library. To check that the process was successful, find the file
in the Content List and check the Date Modified. You can also go to the Content Information page, click the URL, and
view the new version of the content.

146
USING ADOBE CONNECT 8
Managing content
Last updated 5/14/2013
Uploading AICC content
For Adobe Connect to track scores in quizzes and data, content must be AICC compliant. To upload AICC content into
the Content library, store the files in a ZIP archive and upload it from Adobe Connect Central, not from a meeting room.
Keep in mind the following when you create AICC content:
• The content package must have an index.htm or index.html file that the server relies on to launch the content.
• Content must report “Incomplete” on all communications until the user has finished interacting with the content.
• The content must be able to report either “complete” or “passed” to indicate that the user has finished interacting
with the content.
Download files from the Content library
Users who have permission can download Content library files to their computers. If the content is composed of more
than one file, it is packaged into a ZIP file.
1 Click the Content tab.
2 Navigate to the content file that you want to download.
3 Click the name of the content file.
4 Click the Download Content link on the navigation bar.
The Download Content link is on the information page of the item
5 Under Download output file(s), click the content filename.
Users who have Manage permission can download a presentation to deploy it on the Internet or distribute it on a CD.
You can download the presentation PPT source files or output files. To deploy a presentation, download the output
files and extract them.
6 Save the file to your disk.
More Help topics
“View content” on page 148
“View data about all content” on page 149

147
USING ADOBE CONNECT 8
Managing content
Last updated 5/14/2013
Download presentation source files from the Content library
Downloading source files can be helpful if you no longer have your source files for an Adobe Presenter presentation.
(It is critical that you do not overwrite the PPT filename extension with a PPC extension; if you do, the file can become
unusable.)
Note: The only source files available for download are files that have been uploaded. For example, Adobe Presenter and
Adobe Captivate give users the option to upload or not upload source files. If the option to upload source files is not
selected, those files are not available for download later.
1 Click the Content tab.
2 Navigate to the presentation and click its name.
3 Click the Download Content link on the navigation bar.
4 In Download source files, click a file.
5 Save the file to your disk.
6 (Optional) In Download output files, click the zip file and save it to your disk.
More Help topics
“View content” on page 148
“View data about all content” on page 149
Creating custom URLs
When you add a new piece of content, a new meeting, a new course or curriculum, a new seminar, or a new event, you
can create a custom URL for the content. This URL is unique across the entire Adobe Connect account and identifies
the content.
Adding a custom URL
A. Uneditable portion of URL set by your administrator B. Customizable portion of URL
A custom URL can be used with one piece of content at a time. For example, if you assign the custom URL /yourname
to a piece of content, you cannot assign that URL to another piece of content or to a meeting, nor can any other user
who shares your account assign that URL to anything. If you delete the content that uses the custom URL, the custom
URL becomes available for reuse.
If another user is currently using the custom URL, you receive an error message when you enter the URL. If you want
to, you can check with your administrator to see who is using the URL.
Custom URL rules:
• You cannot edit a custom URL after you create it.
• You cannot use digits (0 - 9) at the beginning of a custom URL.
A B

148
USING ADOBE CONNECT 8
Managing content
Last updated 5/14/2013
• Custom URLs cannot contain any punctuation, spaces, or control codes.
• If you enter any uppercase letters, they are automatically converted to lowercase letters to conform to URL case
sensitivity conventions.
• Do not use any of the following reserved keywords in your custom URL:
More Help topics
“Upload content” on page 145
“View data about all content” on page 149
View content
You can open content for viewing from the Content library. If you have the URL for viewing the file, you can also
browse to it directly from any browser window.
More Help topics
“Upload content” on page 145
“View data about all content” on page 149
View content in the Content library
1 Click the Content tab at the top of the Adobe Connect Central window.
2 Browse the Content library, and click a filename to view the associated Content Information page.
3 Click the URL For Viewing link.
A new browser window displays the selected file or presentation.
account content idle report
acrobat course info sco
adobe cs input search
admin cs2 livecycle seminar
administrator curriculum macromedia send
api data meeting service
app default metadata servlet
archives download monitor soap
breeze event open source
builder fcs output src
close flash photoshop stream
com gateway presenter systems
common go producer training
connect home public user
console hosted publish xml

149
USING ADOBE CONNECT 8
Managing content
Last updated 5/14/2013
View content in a web browser
1 Open a browser window.
2 Enter the URL for viewing the content in the browser URL address box or click a link received in an e-mail.
Send a content URL by e-mail
Every content file in the Content library has a unique URL that lets users view the contents of the file. You can send
this URL to other people by e-mail from within Adobe Connect Central.
Adobe Connect creates a unique version of the URL for each e-mail recipient. Compared to pasting the URL in an e-
mail, using Adobe Connect Central has these advantages:
• You can request that Adobe Connect send you a return receipt when an e-mail recipient clicks the web link. You
can track who viewed the contents because a unique URL was created for each recipient.
• Recipients can view the content without having to log in to Adobe Connect. This is true even if the permissions for
the content file in the Content library are not set for public viewing.
1 Click the Content tab at the top of the Adobe Connect Central window.
2 Navigate to the content file and click its name.
3 Click E-mail Link on the navigation bar.
4 Enter the e-mail addresses for all recipients in the To box on the E-mail Link page.
If necessary, separate multiple e-mail addresses with commas to create a unique URL for each e-mail recipient.
5 Edit the Subject and Message Body text boxes as needed.
Note: Do not delete the information in the curly brackets (“{tracking-url}”) in the message body. This placeholder is
replaced with the content URL in the e-mail message.
6 Select Generate a Return Receipt When Content Is Viewed to receive an e-mail notification when a recipient views
the content file; otherwise, clear the check box.
7 Click Send.
More Help topics
“Creating custom URLs” on page 147
“Upload content” on page 145
Viewing data about content
View data about all content
1 In Adobe Connect Central, click Content > Content Dashboard.
The Content Dashboard provides a graphical representation of statistical data about your content. The data reflects all
of the content in your My Content folder and is output to the following categories:
Most Viewed Content Over Last 30 Days The number of views.
Most Effective Presentations Over Last 30 Days Determined by percentage of slides viewed across all viewers.

150
USING ADOBE CONNECT 8
Managing content
Last updated 5/14/2013
Most Recently Viewed Content Over Last 30 Days In list format, shows the name, content type, number of views, and
last time this content was viewed. The most recently viewed is listed first.
Aging Content In list format, shows the name, content type, and last time this content was viewed. The most recently
viewed is listed last.
Click any item to view the corresponding Content Information page.
2 To print the data, click Printable Version.
More Help topics
“Content library supported file types” on page 144
“Upload content” on page 145
View reports about individual pieces of content
Note: In Adobe Connect 7 and later, you can retrieve data about individual pieces of content from a new Reports wizard
(in Connect Central, click Reports
> Content). This section of the documentation describes an older user interface for
viewing data about individual pieces of content. This user interface was left in the product for backwards compatibility.
The new Reports wizard is a better reporting tool.
You can download reports whenever necessary to analyze information about how content is being used.
Where appropriate, you can restrict the information you see on a report by specifying report filters. When the filters
are in effect for a given report, the Report Filters link appears above the report display.
Any filters you set apply to all reports that you create, both for the specific report and for any other Adobe Connect
functionality. For example, if you create a training report after you set filters for a content report, the filters apply to
the training report. This rule applies to any date range you specify. If you do not clear a date range filter that you set
for one report, it applies to all reports.
Note: Report filters are only saved for the current session. If you set report filters, click Save, then logout of Adobe Connect,
when you log in again the report filters you previously set are not retained. However, the Reports wizard does save filters
across sessions.
More Help topics
“About Connect Central reports” on page 195
“Content library supported file types” on page 144
“Upload content” on page 145
Set report filters
1 Access the information page (for example, the Content, Meeting, or Course Information page) for the file whose
report filters you want to set.
2 On the information page, click the Reports link above the Content Information title bar.
A set of report links appears above the title bar, with Summary highlighted, and the Summary report for this meeting
appears below the information heading.
3 Click the report type for which you want to set filters.
The data for the report type you selected appears in the Adobe Connect Central window.
4 Click the Report Filters link, to the right of the No Filters Have Been Set label.

151
USING ADOBE CONNECT 8
Managing content
Last updated 5/14/2013
The Set Report Filters options for a curriculum
5 Set one or more of the following filters:
• To set the date range filters, select the From and To check boxes and the start and end dates and times. For example,
if you select a date range for the By Slides report, it shows only the slides that were viewed within the specified dates.
• To set filters for groups, click the Add/Remove Groups link and select the check box for the groups you want to
track in your report. The data on the report applies only to the members of a specific group that participated. You
can select more than one group, and then deselect any group.
• To select team members (managers only), click either Show Data From People I Manage Directly or Show Data
From People I Manage Directly And Indirectly.
To clear filters you have set, click Reset on the Set Report Filters page.
6 Click Save at the bottom of the Set Report Filters page.
The report page reappears with the filters you set, above the display bar.
Download reports
1 Access the information page (for example, the Content, Meeting, or Course Information page) for the file whose
report you want to download.
2 On the information page, click the Reports link above the Content Information title bar.
3 Click a report type, for example, By Slides or By Questions.
Summary The Summary provides the content name, the date that the content was last modified, and the number of
times this content was viewed.
By Slides or By Pages (PDF) Applies to presentations only. A bar graph lists each slide in the presentation by slide
number and the number times it was viewed. Below the graph is a table with the same information, which also includes
the last time each slide was viewed.
By Questions A bar chart shows each question, color-coded as correct or incorrect, and the number of respondents to
the question. Click a question in the bar to display a pie chart with a table that provides the answer key and answer
distribution. The answer key lists all possible answers for the selected question and their corresponding answer

152
USING ADOBE CONNECT 8
Managing content
Last updated 5/14/2013
number or letter. The answer distribution lists all of the answer choices selected for this question, flags the correct
answer, and shows the number of users who selected each answer, as well as what percent of the total each number of
users represents. Finally, the chart totals the users by number of users and percent of users. Below the graph is a table
that provides an overview of all questions, listing each question by number, name, number of correct answers, number
of incorrect answers, percentage of correct, percentage of incorrect, as well as the score.
By Answers A table provides the maximum possible score, the passing score, the average score, and the high score for
the quiz. For each question, the table also shows the question number, the question itself, and the answer distribution;
that is, how each question was answered, if at all. Click the View Answers link to display a pie chart with a table that
provides the answer key and answer distribution. The answer key lists all of the possible answers for the selected
question and their corresponding answer number or letter. The answer distribution lists all of the answer choices
selected for this question, flags the correct answer, and shows the number of users who selected each answer, as well
as what percent of the total each number of users represents. Finally, the chart totals the users by number of users and
percent of users.
Note: Adobe Connect resets content scores for quizzes and surveys each time the user retrieves the content. This means
that if a user closes the quiz or survey without completing it, then returns to it later, all of the previous answers are lost.
If you do not want the score to reset, and you have access to the Training tab, you can create a course and select the content
in question as the course content. This way, you have turned the content into a course.
The Hide Answer Distribution/Show Answer Distribution button is a toggle for showing and hiding the distribution
of answers for each question.
4 Click the Download Report Data button.
This exports all the report data to a comma-separated values (CSV) file. You can either save or open the report. If you
are running Adobe Connect Central in an Internet Explorer browser and choose to open the report, Windows
automatically opens it in Microsoft Excel. In this case, double-click each cell to see its information.
Another option is to save the CSV file to your desktop, select Notepad from the Accessories menu (select Start >
Accessories
> Notepad), and open the file from Notepad, which makes it easier to read.
In addition, if the Printable Version button appears for a report, you can click the button to export the report to a
browser window and print the report.
Remove report filters
1 Access the information page (for example, the Content, Meeting, Course Information page, and so on) for the file
whose report filter you want to remove.
2 On the information page, click the Reports link above the Content Information title bar.
3 Click a report type, either By Slides, By Questions, or By Answers.
4 Click the Report Filters link.
5 In the Set Filters page, do either of the following:
• To clear all filters, click Reset.
• To clear a specific filter, deselect the check box and click Save; if it’s a group, click Add/Remove Groups, deselect
the group check box, and click Save.

153
Last updated 5/14/2013
Chapter 7: Administering Adobe Connect
Getting started administering accounts
Working in Connect Central
Connect Central is a web application used for working with Adobe Connect accounts. Administrators use Connect
Central to manage an account and its users. Meeting hosts use Connect Central to create and schedule meetings.
Training managers use Connect Central to create courses and enroll participants.
Log in to Connect Central
1 In a browser window, enter the account URL included in the Welcome e-mail.
2 On the Login page, enter your login and password.
3 Click Login.
Edit your profile
1 In Connect Central, click My Profile.
2 Do any of the following:
• Click My Profile to view your user information.
• Click Change My Password to change your password.
• Click Edit My Preferences to change your time zone and language.
• Click My Audio Profiles to select or create an audio profile for an audio conference.
• Click My Audio Providers to select or create your own audio providers. These providers are not available to other
users on the account.
• Click Group Memberships to view your group memberships.
• Click Organization to view your manager and team member information.
Determine Adobe Connect version number
Knowing your version number can be useful, especially when contacting Adobe Connect Support or when reporting
any issues with an application.
❖ Do one of the following:
• On the Connect Central login page, move your insertion point over the Help link. The version number appears.
• In a web browser address field, enter http://<connect_url>/version.txt and press Go.
Search content
1 Start Connect Central.
2 Do one of the following to search any content to which you have access permission:
• Type keywords directly into the Search text box on the Home page to search through content.

154
USING ADOBE CONNECT 8
Administering Adobe Connect
Last updated 5/14/2013
• Click Advanced Search.
3 If you selected Advanced Search in step 2, do one of the following:
• Select Search Within Content to search recordings, courses, presentations, or all of them. If desired, use the Show
menu to narrow your search.
• Select Search Titles and Descriptions to search content, meetings, training, seminars, folder or all of them. If
desired, use the Show menu, Field menu, and Date Created fields to further narrow your search.
4 Type keywords into the search field and click Go.
Detailed results are listed in the bottom pane. Click a column header to sort the results.
5 (Optional) Click on the name of an item to open the item for viewing. Click a parent folder to open the folder that
contains the item.
Note: It is possible to have access to an object, but not to the folder containing the object.
Connect Central icons
Connect Central uses icons to represent meetings, seminars, presentations, courses, and curriculums.
Course A presentation that is associated with a group of enrolled learners with tracking for each individual. The
course can be used independently or as part of a curriculum.
Curriculum A group of courses and other learning content that guides students along a learning path. Curriculum
can include Adobe Connect content, presentations, meetings, seminars, and external content such as classroom
sessions and reading lists.
External training In a curriculum, training that occurs outside Connect, such as classroom training.
Event An Adobe Connect event includes registration, invitations, reminders, and reporting. Events usually
involve a large number of participants and are built upon an Adobe Connect meeting, seminar, presentation, or
training.
Meeting An online real-time meeting in which a host or presenter can show slides or multimedia presentations,
share screens, chat, and broadcast live audio and video.
Virtual Classroom An online class with customizable layouts and reusable, archived content. Virtual classrooms
have audio and video capabilities, as well as breakout rooms for collaborative learning.
Seminar A seminar is a scheduled meeting conducted for at least 50 participants and involves little audience
participation or interaction.
Archive A recorded meeting or seminar, that users can view at their convenience.
Authorware content Files created in Macromedia Authorware from Adobe. Authorware is a visual tool for
creating e-learning applications.
Presentation A presentation created with Adobe Presenter, a plug-in for Microsoft PowerPoint that lets users add
audio, quizzes, and visual features to a PowerPoint presentation. PPT and PPTX files are converted to presentations
when they are uploaded to Adobe Connect.
Image file (JPEG, GIF, PNG, BMP) Image files can be drawings, photographs, charts, graphs, icons, or any other type
of graphics.

155
USING ADOBE CONNECT 8
Administering Adobe Connect
Last updated 5/14/2013
FLV file A video file.
HTML file File defining the structure and layout of a web document using a variety of tags.
MP3 file An audio file.
PDF file An Adobe PDF file.
SWF file A Flash Player multimedia file.
Creating administrators
Administrators are users who manage Adobe Connect for their entire organization. Administrators create, remove,
and manage user accounts. Administrators manage permissions for individual users and groups. Administrators
perform these tasks using a web application called Connect Central.
There are two levels of Adobe Connect administrator: administrator and limited administrator. Administrators have
full administrative privileges; limited administrators have lesser administrative privileges. Administrators can set
permissions for limited administrators.
The first administrator is created when Adobe Connect is installed or when the account is created. The administrator
can then create additional administrators and limited administrators. For example, an administrator can create limited
administrator accounts for Help Desk employees who support Adobe Connect users.
Create an administrator
1 Log in to Connect Central.
2 Click Administration > Users and Groups.
3 Select a user and click Information.
4 Click Edit Group Membership.
5 Select the Administrators group and click Add.
Create a limited administrator
1 Log in to Connect Central.
2 Click Administration > Users and Groups.
3 Select a user and click Information.
4 Click Edit Group Membership.
5 Select the Administrators - Limited group and click Add.
Set permissions for the limited administrators group
1 Log in to Connect Central.
2 Click Administration > Users and Groups.
3 Select Administrators - Limited and click Information.
4 Click Edit Limited Administrator Permissions.
5 Select the check boxes beside the permissions you want to grant in the following sections and click Save.
Users and Groups Checking View User Data lets limited administrators view and user information in the
Administrator
> Users and Groups tab.

156
USING ADOBE CONNECT 8
Administering Adobe Connect
Last updated 5/14/2013
Checking Reset Password lets limited administrators create a temporary password for a user. See “Edit user
information” on page 182.
Checking Modify current users and groups lets limited administrators edit user and group info. See “Managing users
and groups” on page 182.
Checking Add users and groups using Web interface lets limited administrators use the Administration > Users and
Groups interface. Checking Add users and groups using CSV import lets limited administrators import users and
groups from a CSV (comma-separated value) file. See
“Creating and importing users and groups” on page 175.
Checking Delete users and groups lets limited administrators delete users and groups. See “Managing users and
groups” on page 182.
Checking Modify user profile fields lets limited administrators access the Administrator > Users and Groups >
Customize User Profile tab. See
“Customize user profile fields” on page 176.
Checking Change the login and password policies lets limited administrators access the Administration > Users and
Groups
> Edit Login and Password Policies tab. See “Set login and password policies” on page 177.
Checking Cost Centers lets limited administrators access the Administrator > Users and Groups > Cost Centers tab.
See
“Allocate meeting minutes to cost centers” on page 162.
Account Management Checking Edit account information lets limited administrators access the Administration >
Account
> Edit Information tab to edit the default language, time zone, and Event user policy for an account. Limited
administrators can also edit the primary contact information for an account.
Checking Receive Notifications about Account Capacity and Expiration lets limited administrators access the
Administration
> Account > Notifications tab. See “Edit account notification settings” on page 158.
Customization Lets limited administrators access the Administration > Customization tab if the customization
feature is enabled for their account. See
“Customize the branding of an account” on page 159.
Reports Checking View disk usage and reports lets limited administrators view reports in the following sections of
Connect Central: Administration
> Account > Disk Usage; Administration > Account > Reports; Administration >
Administration Dashboard.
Checking View System Usage Reports lets limited administrators view System Usage reports in the Reports wizard
(click the Reports tab in Connect Central). See
“Generating reports in Connect Central” on page 195.
Compliance and Control Lets limited administrators access the Administration > Compliance and Control tab to
ensure that the account adheres to government standards for privacy, communication, and archiving. See
“Working
with compliance and control settings” on page 163.
Permissions Lets limited administrators set permissions for content in the Content, Training, Meetings, Seminar
Rooms, and Event Management libraries in Connect Central. Within the library, choose Set Permissions. See
“Set
permissions for content files and folders” on page 193.
6 Click Reset to Default to restore default limited administrator permissions.
View and edit account information
The Account Summary page appears when you click the Administration tab. It describes the applications and products
that are enabled for this account.
Most of the account information on the Account Summary page cannot be changed through Connect Central. You
can modify the following account settings in Connect Central: the default time zone, the default language, the Event
user policy (if the Events feature is part of your account), and the primary contact information.

157
USING ADOBE CONNECT 8
Administering Adobe Connect
Last updated 5/14/2013
The information that you modify here applies to the entire account. (To change your own user account profile
information, click My Profile in the upper-right corner and use the Edit My Preferences option.)
View account information
1 Log in to Connect Central
2 Click the Administration tab.
The Account Summary shows details about your account and its features.
Under the Features and Advanced Features headings, you see information about your account. The check mark by the
application name means it is enabled.
System Features Bandwidth per Month shows the amount of data transmitted to or from your account monthly
compared to the amount of bandwidth you are allowed to use. Disk Usage (MB) shows the amount of hard drive space
consumed by your account compared to the amount of disk space you are allowed to use.
Presentation The number of authors in your installation compared to the number that is permitted.
Training The pricing model that your organization uses for training. Training managers lists the number of managers
in your installation compared to the number that is permitted. Named Training Learners lists the number of learners
that have been added to the learners group compared to the number that is permitted. (Only members of this group
can view training content.) Training Concurrent Learner License Limit lists the number of users who can
simultaneously view training content.
Meeting The pricing model that your organization uses for attendees. Meeting Hosts lists the number of hosts in your
installation compared to the number that is permitted. Meeting Peak Concurrent Users lists the number of users who
can simultaneously attend meetings. (The Soft Limit is the amount of quota that was purchased and the Hard Limit is
the amount of quota that is enforced.) The Concurrent Users Per Meeting is the number of users who can
simultaneously attend a single meeting. Burst Pack Minutes are prepaid overage minutes. One burst pack comes with
5000 minutes.
Seminar Rooms The number of Seminar Hosts in your installation compared to the number that is permitted.
Event Management The number of Event Managers in your installation compared to the number that is permitted.
Enable FlashPaper An Adobe product that enables you to convert HTML, Microsoft Word, and PowerPoint files into
Flash documents for the web. Adobe has stopped new feature development for FlashPaper. Adobe recommends using
PDF to present and collaborate on documents in Connect.
Customization and Rebranding A feature that allows you to customize and brand your account.
Requires SSL Connection A feature that determines whether your account uses SSL to encrypt all communication
between the server and connected users.
Reports A feature that allows you to access the Reports wizard.
Edit account information
1 Log in to Connect Central.
2 Click the Administration tab.
3 Click Edit Information.
4 Do any of the following:
• To change the default language, select a language from the Default Language pop-up menu.
• To change the default time zone, select a time zone from the Default Time Zone pop-up menu.

158
USING ADOBE CONNECT 8
Administering Adobe Connect
Last updated 5/14/2013
• To change the rule for event registrants, select an option from the Event User Policy pop-up menu.
• To change the contact information, enter a first name, last name, and e-mail address in the Primary Contact text
boxes.
5 Click Save.
Pricing models
The pricing model determines how your organization pays for its usage and is associated with the quota and usage
information that you see under System Features. There are different models for training and meetings.
There is one pricing model for training:
Concurrent learners This model limits how many learners can be active in all courses or curriculums at the same time.
There are two pricing models for meetings; you see the information appropriate for the model that your organization
purchased:
Named organizer This model limits how many users can initiate meetings. Each named organizer can initiate one
active meeting at a time. Each meeting is limited to the number of participants specified in the license file. A named
organizer must be present to start a meeting, and a meeting ends if all named organizers leave the meeting.
Concurrent attendee This model limits how many participants can be active in a meeting at the same time. The limit
does not affect seminar attendees.
Note: You cannot have quotas for named organizers and concurrent attendees at the same time.
Seminar rooms quotas do not affect any other quotas. There is a seminar attendee limit, which determines how many
participants can be active in a seminar at the same time. This limit applies to each seminar room independently.
Both the named organizer and concurrent attendee pricing models display the same fields, however, some fields are
irrelevant based on the pricing model your organization has purchased:
• If your organization uses the concurrent user model, then the Concurrent Users Per Meeting field is irrelevant, as
the account is bound by the information in the Meeting Peak Concurrent Users field. If the Concurrent Users Per
Meeting field displays "unlimited," this indicates that Connect does not limit the size of any given room. However,
there is an upper limit specifying the number of concurrent users the account supports.
• If your organization uses the named organizer model, Connect specifies a maximum room capacity, which is
displayed in the Concurrent Users Per Meeting field. The Meeting Peak Concurrent Users field is irrelevant when
using the named organizer model, as Connect limits the number of organizers using the Concurrent Users Per
Meeting field, which is typically set at 100 users.
Edit account notification settings
Adobe Connect notifies the account administrator (and optionally, additional users) when an account license is about
to expire and when an account approaches its various capacities.
1 Log in to Connect Central.
2 Click the Administration tab.
3 With Account selected, click Notifications and choose the desired settings.

159
USING ADOBE CONNECT 8
Administering Adobe Connect
Last updated 5/14/2013
Configure multiple product notifications
To notify users about frequent updates, administrators must send multiple system maintenance notifications and
account-based product notifications simultaneously. For example, an administrator may want to send a breakfix
notification to all users in addition to the regular account-based Connect upgrade notifications.
User accounts are usually preconfigured to receive maintenance notifications. However, you can configure specific
user accounts to receive product-based notifications.
Do the following:
1 Choose Administration > Account > Notifications.
2 Under Product Notification Settings, select the start date and end date for the notifications.
3 In the message box, type the notification message and click Save. When the user opens a meeting, the product
notification message is displayed in the Notifications pod.
You can configure a user account to receive a maximum of three notifications at a time. Normally, you send two
maintenance notifications and a single product-based notification. However, based on requirements, you can
configure a specific user account to receive three maintenance notifications. The maintenance notifications have a
higher priority compared to product-based notifications. Therefore, maintenance notifications appear on the top in
the Notifications pod. The user may close a particular notification after viewing it. The notification reappears on the
Notifications pod when the user reopens the meeting. Alternatively, the user can choose Don’t show this message again
to prevent the notification from reappearing when the meeting reopens.
View account usage information
1 Log in to Connect Central and click the Administration tab.
2 Click Administration Dashboard to see a graphical representation of your quota usage across the system.
3 Move the pointer over any bar to see the precise maximum figure for that bar.
The gray bar represents your current usage, and the dark green bar represents your limit.
4 Click either bar in a group quota graph to display a group information page.
The group information page lists the name and a description of the group. Click the View Group Members button to
view current members and add new members.
Customize the branding of an account
If your organization purchased the customization features, the Customization link is enabled on the Administration
tab. The customization features let you adapt the appearance of Adobe Connect to match the branding of your
organization.
To see your customization changes, log out and log back in to Connect Central and refresh the browser.
Customize the Connect Central user interface
Use the Customize Banner link to customize the following elements of the Connect Central user interface (user
interface):
• Background color.
• Top links text color (for the My Profile, Help, and Logout links in the upper-right corner).
• Navigation text color (for the links below the tab bar).
• Selection highlight color.

160
USING ADOBE CONNECT 8
Administering Adobe Connect
Last updated 5/14/2013
• Table header color (for the bars that identify page titles or columns on list pages).
• Banner logo, the image that appears in the upper-left corner of Connect Central. The image must be a JPEG, PNG,
GIF, or BMP file and must be 360
x 50 pixels.
Customize Banner settings
A. Banner logo B. Navigation text C. Selection highlight D. Table header
1 Click the Administration tab.
2 Click Customization.
3 In the list to the right of the color grid, click the item whose color you want to change.
4 Do one of the following:
• Click a color in the grid.
• Enter a color code, such as #33CC66, into the text box.
5 To change the color swatch to the previous setting, click Clear. To restore all colors and the banner logo to the
defaults, click Reset To Default.
6 To select a banner logo, click Browse below the Banner Logo heading and browse for the logo image (JPEG, PNG,
GIF, or BMP file). If you don’t select a logo, the Adobe Connect logo appears in the banner.
7 Click Apply to save your changes.
Your changes appear in 5 seconds to 10 seconds; alternatively, you can refresh the page.
Note: After you select a banner logo, the logo displays in the preview area. When you click Apply to save your changes,
sometimes the banner preview area displays the old banner. The new banner logo displays correctly for users. To see the
correct banner, log out and back in to Connect Central and refresh the browser.
Customize the login page
Use the Customize Login link to customize the login page. You can modify any of the following attributes:
• Meeting title color
A
C
B
D

161
USING ADOBE CONNECT 8
Administering Adobe Connect
Last updated 5/14/2013
• Login text color
• Background color (login area color)
• Main logo image, which must be a 410 x 310 pixel JPEG, PNG, GIF, or BMP file
Customize Login settings
A. Main logo B. Meeting title C. Login text D. Background
1 Click the Administration tab.
2 Click Customization.
3 Click Customize Login.
4 In the list to the right of the color grid, click the item whose color you want to change.
5 Click a color in the grid.
6 To change the color swatch to the previous setting, click Clear. To restore the original setting, click Reset To
Default.
7 To select a main logo, click Browse below the Main Logo heading and browse for the logo image (JPG, PNG, GIF,
or BMP file). If you don’t select a logo, the Adobe Connect logo is used as the main logo.
8 Click Apply to save your changes.
Your changes appear in 5 seconds to 10 seconds; alternatively, you can refresh the page.
Note: After you select a logo, the logo displays in the preview area. When you click Apply to save your changes, sometimes
the banner preview area displays the old logo. The new logo displays correctly for users. To see the correct logo,log out and
back in to Connect Central and refresh the browser.
B
D
C
A

162
USING ADOBE CONNECT 8
Administering Adobe Connect
Last updated 5/14/2013
Customize the appearance of Connect meetings
Use the Customize Meeting option to modify the appearance of Connect meetings. The settings you apply here appear
in every meeting created in your account. (These settings do not affect the meeting layout.)
1 Click the Administration tab.
2 Click Customization.
3 Click Customize Meeting.
4 In the list to the right of the color grid, click one of the following:
• Menu highlight color
• Button focus color (the color outline that appears around a button when you move the pointer over it)
• Background color
• App bar color (the color of the upper application bar)
• App bar text (the color of menu text)
5 Click a color in the grid.
6 To change the color swatch to the previous setting, click Clear. To restore the original setting, click Reset To
Default.
7 To select a meeting logo, click Browse, and choose a JPEG, PNG, GIF, or BMP file that’s 50 x 31 pixels (other sizes
are scaled to fit). If you do not select a logo, the Adobe Connect logo is used.
8 To link the logo to a website, enter a path in the Logo URL box.
9 Click Apply to save your changes.
Your changes appear in 5 seconds to 10 seconds; alternatively, you can refresh the page.
Allocate meeting minutes to cost centers
When you import users to Adobe Connect, you can associate each user with a cost center. If users are associated with
cost centers, you can enable cost center reporting to determine how much each cost center is using Adobe Connect.
The easiest way to associate users with cost centers is when you import users in a CSV file or synchronize with an
LDAP directory service. If you don’t use either of these methods, you can also associate a user with a cost center
manually.
If cost center reporting is disabled, meetings are not tracked for reporting purposes. If users are not assigned to cost
centers and meetings are billed per attendee, Connect does not track data for those users.
More Help topics
“Import users and groups from CSV files” on page 178
Associate users with cost centers manually
1 Log in to Connect Central.
2 Click the Administration tab then click Users and Groups.
3 Select a user from the list and click Information.
4 Click Edit information.
5 Click the Choose button beside the Cost Center box.
6 Select a cost center from the list. If the cost center isn’t in the list, click the plus sign to add it.

163
USING ADOBE CONNECT 8
Administering Adobe Connect
Last updated 5/14/2013
7 Click Save.
Enable cost center reporting
1 Log in to Connect Central.
2 Click the Administration tab.
3 Click Users and Groups then click Cost Centers.
4 Choose a radio button to determine how minutes are allocated.
If you choose Allow each meeting host to determine how minutes will be allocated, the host can choose from a Cost
Center pop-up menu when creating a meeting.
5 To search, add, delete, or edit a cost center, click Manage Cost Centers.
6 Click Save.
Disable cost center reporting
1 Log in to Connect Central.
2 Click the Administration tab.
3 Click Users and Groups then click Cost Centers.
4 Deselect Enable Cost Center Reporting.
5 Click Save.
Working with compliance and control settings
Organizations operating in regulated industries are required to comply with government standards. These standards
dictate how and when employees can communicate and whether the organization must record and archive
communication. For example, some organizations are required to log all communications that take place on their
networks.
Organizations can also choose to retain communications between employees or between employees and external users
to meet standards of internal control. Use the compliance and control settings to adhere to standards and control the
global meeting experience.
Compliance and control settings are global settings that effect the entire Adobe Connect account. Settings apply
immediately to all meeting sessions that begin after the settings are saved. Settings do not apply to meetings that are in
progress when settings are saved. Settings apply to recent meetings up to 10 minutes after the meetings end.
Note: Not all compliance features are available to Hosted customers.
More Help topics
“Share your screen” on page 27
Customize compliance and control settings
1 Log in to Connect Central.
2 Click the Administration tab.
3 Click Compliance and Control.

164
USING ADOBE CONNECT 8
Administering Adobe Connect
Last updated 5/14/2013
4 Click Pods Management and do any of the following:
• Select any pods you want to disable in meeting rooms and virtual classrooms. If you disable a pod, the pod and all
information in the pod is erased in every meeting room that contains the pod. Disabling pods can leave empty space
in meeting room layouts. Update your meeting templates and resize the pods to fill up any spaces.
• Choose whether to disable interactive audio betwen VoIP and conference bridge.
• Choose whether to disable broadcast from conference bridge. The audio from the bridge is used for recording only.
• Choose whether to disable Video telephony.
5 Click Share Settings and do any of the following:
• Choose whether to Disable Desktop sharing, Disable Windows sharing, or Disable Applications sharing. Individual
screen sharing modes lets you disable screen sharing modes and prevents users from sharing unauthorized content.
For more information on screen sharing modes see,
“Screen sharing options” on page 28.
• Choose whether to Disable Request for Control to prevent users from requesting control of another user’s shared
screen.
• Choose whether to Disable screen sharing’s “Pause and Annotate” feature to disable the Share pod’s overlay
whiteboard.
• Choose whether to Restrict screen sharing to specific processes to specify applications that users can share. See
“Specify applications to share or block” on page 165.
• Under the Document Sharing settings, choose one or more of the following. If you select all the options, the Share
Documents option is removed from the Share pod.
Choose Share pod: disable uploading of documents to the meeting, to prevent users from sharing documents on their
computers.
Choose Share pod: disable uploading of documents from the Content and Course libraries, to prevent users from
sharing documents that are published in the content and course libraries. This setting prevents users from uploading
content directly into a meeting room. A host or presenter can share only content that was preloaded into Connect
Central.
Choose Disable Whiteboard, to disable the whiteboard from the Share pod.
• Choose Disable File Share pod, to remove the file share pod from all meetings.
• Select Disable Breakout rooms to prevent creating breakout rooms.
• Select Disable option to open the web link on ending the meeting.
6 Click Recordings and Notice and do any of the following:
Note: Only the Enable compliance notice setting is available to hosted customers. Hosted customers cannot force
recording settings or enable chat transcripts.
• Select Lock Recording Settings For All Meetings and Record All Meetings (On), to record all meetings. No one can
stop the recording, not even the meeting host. Only administrators can access forced recordings unless you select
Publish Recording Links In Meeting Folders. In this case, the meeting host can access the recording through the
link available in the meeting folder. The meeting host can edit the forced recording but administrators can still
access the original recording as needed. The Presenter Only Area and breakout rooms are never recorded. If you
need to record all meeting activities, choose Disable Breakout rooms on the Share Settings page. Select Never
Record Any Meeting (Off), to disable the Meeting
> Record Meeting command in all meeting rooms.
• Select Allow For Distribution Of Local Copies Of Recordings To End Users to allow users to download recordings
in Adobe Connect Desktop.

165
USING ADOBE CONNECT 8
Administering Adobe Connect
Last updated 5/14/2013
• Select Enable Chat Transcripts to log all chat messages on the server. The transcripts contain the name of the room,
the name of the sender, the name of the recipient, the date and time, and the message body for each chat message.
Transcripts are stored on the Adobe Connect server in the folder rootinstall\content\account-id\sco-id-
version\output\ (for example, C:\breeze\content\7\21838-1\output). The file name format and type is
roomname_date_time.xml. Chat transcripts do not log text in the Note pod and chat communication in breakout
rooms. To record all text-based conversation, disable the Note pod and breakout rooms.
• Select Enable Compliance Notice and enter notice text to force all users to accept the terms of the notice before
entering meeting rooms. The acceptance is recorded in the server log. For example, licensed customers can use this
notice to inform users that a meeting is or is not being recorded.
• Under the Record meeting audio on Telephony Provider’s Bridge, select the audio providers for which recording
also needs to be done on the provider’s audio bridge. By default, the recording is done using Universal Voice for
audio providers.
7 Click Training Settings and select whether you want to enable open enrollment.
8 Click Save to save changes.
Specify applications to share or block
To prevent users from sharing unauthorized applications or processes, you can do one of the following:
• Create a whitelist of authorized applications
• Create a blacklist of applications or processes that cannot be shared
These two options are mutually exclusive: you can either specify a whitelist or a blacklist. Applications that are
included in the blacklist are not available for participants, presenters, and hosts to share. To prevent users from sharing
unauthorized applications or processes, enter separate Windows, Linux, and Mac OS applications in the text boxes.
The list of available items appears when users select Windows or Applications from the Start Screen Sharing window.
1 Select the Restrict Screensharing To Specific Processes option.
2 To determine the name of the application executable:
Windows Do one of the following:
• Navigate to the application folder (Typically C:\Program Files\application folder) and read the application
executable name. For example, the executable name of Microsoft Office PowerPoint is POWERPNT.EXE.
• Start Windows Task Manger (right-click an empty spot in the Windows Taskbar and choose Task Manager from
the context menu). Then select the Processes tab to list all running processes.
Linux Do one of the following to list all running processes:
Note: These examples are from Ubuntu; other Linux systems have similar options.
• Enter the ps (process status) command.
• Choose System > Administration > System Monitor. Then click the Processes tab.
Mac OS Do one of the following:
• Navigate to the application folder and read the application’s executable name.
• Open the Activity Monitor (Mac OS X 10.3 or later) or the Process Viewer (Mac OS X 10.0 and 10.2). Select All
Processes from the Show pop-up menu to list all running processes.
3 Select one of the following options:
• Allow Only The Sharing Of The Following Processes.
• Prevent The Sharing Of The Following Processes.

166
USING ADOBE CONNECT 8
Administering Adobe Connect
Last updated 5/14/2013
4 Enter the list of executable names as colon-separated values for Windows, Linux, and Mac. For example,
Windows powerpnt.exe:winword.exe:notepad.exe
Mac OS iTunes.app: iPhoto.app: iChat.app
Linux soffice.bin
5 Click Save.
View forced recordings
1 In Connect Central, administrators can click on Content > Forced Recordings to view all the forced recordings in
an account.
2 Click on a recording name to view information about the recording.
3 Do one of the following:
• Click Edit to edit the title, summary, or language of a recording.
• Click the URL for Viewing to view the recording.
Create a link to a forced recording
Links point to the latest version of the recording. If any editing is done to the recording (either directly or through any
link) the edits are reflected in all the links to that recording.
1 In Connect Central, administrators can click on Content > Forced Recordings to view all the forced recordings in
an account.
2 Select the checkbox for the meeting you want to link.
3 Click Create Link.
4 Navigate to the Content folder where you want to add the link.
5 Click Create Link.
Delete forced recordings
Only administrators can delete forced recordings.
1 In Connect Central, click on Content > Forced Recordings to view all the forced recordings in an account.
2 Select the checkbox for the meeting you want to delete.
3 Click Delete.
Configure the Training Catalog
Only administrators have access to the Training Catalog by default. An administrator must set permissions for the
Training Catalog before Training Managers can use it. Administrators can create any folder and permissions structure.
For example, an Administrator could give the whole Training Managers group permission to manage the root folder
of the Training Catalog. In another example, an Administrator could create folders for each Training Manager.
Create a custom URL and name for the Training Catalog
Creating a custom URL is optional. If you don’t create one, the system generates one, but it’s easier to use a URL you
create.
1 Log in to Connect Central.

167
USING ADOBE CONNECT 8
Administering Adobe Connect
Last updated 5/14/2013
2 Click Training > Training Catalog > Edit Information.
3 Enter a name for the top-level folder.
4 Enter a custom URL.
All bookmarks to content in the Training Catalog use the custom URL. If you change the custom URL, existing
bookmarks break.
5 (Optional) Enter a description for the folder in the Summary field.
Create a folder structure and set permissions
1 Log in to Connect Central.
2 Click Training > Training Catalog.
3 If you want Training Managers to create their own folders and set permissions for those folders, while in the root
folder, click Set Permissions.
4 Select Training Managers and click Add to give them permissions to the root folder.
5 If you want to create a folder structure, while in the root folder, click New Folder and give the folder a name and,
optionally, a description.
6 Click Set Permissions to set permissions for the new folder.
7 Select any groups or users you want to have permission and click Add.
8 You can repeat these steps to create any folder and permissions structure you desire.
Connect Central How To Topics
Content
• “Working with content in the Content library” on page 144
• “Upload content” on page 145
• “Viewing data about content” on page 149
Training
• “About Adobe Connect Training” on page 54
• “Creating training courses” on page 60
• “Creating training curriculums” on page 67
• “Creating virtual classrooms” on page 79
• “Monitoring training with reports” on page 84
• “Manage the Training Catalog” on page 91
Meetings
• “Meeting basics” on page 5
• “Create meetings” on page 9
• “Start meetings” on page 14

168
USING ADOBE CONNECT 8
Administering Adobe Connect
Last updated 5/14/2013
• “Start meeting audio” on page 127
• “Meeting room templates and layouts” on page 10
• “Share a document or PDF” on page 29
• “Share a presentation” on page 31
• “Upload and manage files using the File Share pod” on page 35
• “Updating meetings” on page 19
• “Viewing data about meetings” on page 25
Seminar Rooms
• “About seminars” on page 96
• “Creating a seminar” on page 97
• “Seminar reports” on page 101
Event Management
• “Creating an event” on page 105
• “Change an existing event” on page 108
Reports
• “Generating reports in Connect Central” on page 195
• “Viewing data about meetings” on page 25
Administration
• “View and edit account information” on page 156
• “Edit account notification settings” on page 158
• “Working with compliance and control settings” on page 163
• “Configure audio providers for universal voice” on page 169
• “Configure video telephony devices” on page 174
• “Allocate meeting minutes to cost centers” on page 162
• “Creating administrators” on page 155
• “Creating and importing users and groups” on page 175
• “Setting permissions for library files and folders” on page 187
• “Managing users and groups” on page 182
• “Generating reports in Connect Central” on page 195

169
USING ADOBE CONNECT 8
Administering Adobe Connect
Last updated 5/14/2013
Configure audio providers for universal voice
About universal voice audio providers
Audio providers are companies that provide audio conferencing services that work with Connect. Administrators
configure the audio providers that everyone on an account can use. Hosts configure providers for a specific use, such
as a meeting. Both account administrators and hosts can configure an audio provider for universal voice.
The configuration for a universal voice audio provider includes the details required for hosts and participants to join
an audio conference, such as the telephone numbers and steps required to dial into the audio conference. The
configuration also specifies the host-defined options. For example, administrators configure the tones and pauses for
dialing into a meeting. Hosts provide the meeting ID and any passwords that participants use to join the audio
conference.
Once you configure a universal voice audio provider, meeting hosts can create audio profiles that map to the provider.
Audio profiles contain the audio conference settings used to start an audio conference.
Universal voice audio providers include these types:
• Integrated telephony providers that have been enabled for universal voice.
• User-configured by a meeting host or account administrator.
For more information about Connect audio providers, see “Audio conferencing options” on page 122. Adobe Connect
accepts either a free phone numbers originating in the United Kingdom of the format 0800 or 0808 or an international
free phone numbers of the format 00800.
View audio providers
All available audio providers for a specific account appear in the Provider Information window. Each audio provider
is configured with descriptive information and a dialing sequence for connecting to an audio conference. You can view
the information associated with any audio provider on the account. Only enabled providers can be edited.
Note: Administrators, limited administrators, and hosts can access this window.
1 Do one of the following to view the provider list:
• (Administrators) Click the Administration tab at the top of the Adobe Connect Central window, and then click
Audio Providers.
• (Hosts) Click My Profile at the upper-right corner of the Connect window, and then click My Audio Providers.
2 To view provider information, select the provider in the list.

170
USING ADOBE CONNECT 8
Administering Adobe Connect
Last updated 5/14/2013
Available audio providers and audio conference information for one provider
More Help topics
“Using universal voice” on page 123
“Create and use audio profiles” on page 125
Create or edit audio providers
Use the New/Edit Audio Provider window to configure universal voice audio providers. Fields in the New/Edit Audio
Provider dialog box with a red star are required.
When you add an audio provider to an account, the provider appears in the Provider Information window
(Administration
> Audio Providers or My Profile > My Audio Providers).

171
USING ADOBE CONNECT 8
Administering Adobe Connect
Last updated 5/14/2013
New Audio Provider window
1 Do one of the following to view the provider list:
• (Administrators) Click the Administration tab at the top of the Adobe Connect Central window, and then click
Audio Providers.
• (Hosts) Click My Profile at the upper-right corner of the Connect window, and then click My Audio Providers.
2 Do one of the following to add conferencing details for a provider:
• To add a provider, click New Provider.
• To edit a user-configured provider, select the provider in the left pane and click Edit.
3 Add or change conference identification details and click Save.
Provider Name Name of the audio provider, such as MeetingPlace.
Provider Status (Enabled/Disabled) Only enabled providers can be edited. Enabled providers appear to hosts when
they set up an audio profile for an audio conference. You can enable multiple providers for an account.
Important: Disabling a provider also disables all the current audio profiles set up for this provider and disassociates
the audio profiles from the meetings.
URL A link to an information page. For example, this page can include conference account details for hosts to use
when setting up their audio profiles. The information page could also be a sign-up page for purchasing a conference
account from an audio provider. Account administrators typically create these information pages.
Dial-In Numbers Numbers for dialing into a meeting. To add dial-in numbers, click Add Number, click the word
Location, and type a name, such as Internal or the country name. Click the word Number and type the dial-in
number. The dial-in numbers appear in the upper-right corner of the meeting room.
Note: Provide either a free phone number originating in the United Kingdom of the format 0800 or 0808 or an
international free phone numbers of the format 00800.
Dial-In Steps A sequence of DTMF tones and pauses for dialing into an audio conference. The dialing sequence
also include the conference number as the first step.

172
USING ADOBE CONNECT 8
Administering Adobe Connect
Last updated 5/14/2013
Define a dialing sequence
The dialing sequence or dial-in steps are DTMF tones and pauses for dialing into an audio conference. In hosted
accounts, the Adobe Connect server uses the dialing sequence to join the audio conference in the background when
the host joins the conference in the meeting room. Some DTMF tones can be host-defined options, such as participant
codes. You build a dialing sequence for a provider by placing these items in sequence in a table.
A well-defined dialing sequence can require small and frequent adjustments to the dial-in steps. One way to create
the flow of steps is to dial into the audio conferencing service using a telephone and take notes. For example, dial in
as a moderator and start the audio conference. Use a separate telephone to dial into the conference as a participant, and
then write down the steps to enter the conference.
Example of a dialing sequence
A. Telephone number to join the audio conference B. DTMF tones and pauses between actions C. Name for the step D. Values entered to
program the step E. Displayed in meeting F. Not displayed in meeting G. Displays information as a text box
Most options appear in pop-up menus. To display a pop-up menu, click the information in each row.
A
B
CDEF
G

173
USING ADOBE CONNECT 8
Administering Adobe Connect
Last updated 5/14/2013
Available choices for the Display In Meeting column
1 In the Dial-In Steps section of the New/Edit Provider window, click Add Step.
2 In the Action column, click the information in the first row, and select Conference Number from the pop-up menu.
Enter the dial-in number for the meeting room and specify the remaining information for that step.
3 For each remaining step in the dialing sequence, specify DTMF tones and pauses.
4 To move a step up or down in the sequence, select the step and use the Up or Down Arrows.
5 To delete a step, select it and click Remove.
6 When you’re finished, click Save.
Dialing sequence options
Action column
Conference Number The telephone number for joining the audio conference. The conference number must be the
first step in the dialing sequence. Hosted accounts, where Adobe provides the server for the account, require a toll free
U.S. telephone number to join an audio conference. On-premise or licensed accounts can use any number. Only one
conference number is allowed.
DTMF Buttons on a telephone keypad, such as the pound key (#).
Delay (ms) The delay in milliseconds between each action. These delays provide pauses before a meeting participant
enters information. For example, users wait for a welcome announcement before entering a participant code. You
specify the amount of delay in the Key/Number column.
Label column
Label An identifier for the action. For example, to program a DTMF action for a meeting ID, replace the word Label
in the column with Meeting ID. Only labels for Defined By Host actions appear in the program. In the Meeting ID
example, a text box labeled Meeting ID appears when hosts create an audio profile for this provider.
Key/Number column
In this column, you choose which steps a host has to define. Host-defined steps appear when a meeting host sets up an
audio profile for an audio conference.
(blank) The numbers or symbols on a telephone keypad required to complete the step. For example, to program a
pause of 5000 milliseconds for users to wait for a welcome announcement, click the blank option and enter 5000.
Defined By Host Account administrators choose this option when they want hosts to enter information while setting
up an audio profile for an audio conference. For example, a host-defined DTMF action with the label “Meeting ID”
requires the host to enter the meeting ID when setting up the audio profile.

174
USING ADOBE CONNECT 8
Administering Adobe Connect
Last updated 5/14/2013
Display In Meeting column
The pop-up menu in this column is available only for Defined By Host steps.
False/True Determines whether the information for this action is displayed in the meeting invitation and upper-right
corner of the meeting room window.
Input Type column
The pop-up menu in this column is available only for Defined By Host steps. The options define how information
appears when hosts set up audio profiles. These options also determine how the information appears in read-only
pages, such as the Audio Conference Information section in a meeting room.
Text Displays a single-line text box in the audio profile, and a single line of information in read-only pages.
Password Shows the information as asterisk characters (*).
Test a dialing sequence
It’s a good idea to test the dialing sequence before you use it to start an audio conference. Using this test, you can ensure
that you have accounted for all the required steps and that the delays between steps are sufficient. If you have added
any host-defined steps to the dialing sequence, be prepared to enter that information in the Test Dial-In Steps dialog
box. For example, to have Connect dial into the audio conference as a participant, enter the participant code in the
dialog box.
1 Click Test Dial-In Steps at the bottom of the dialing sequence.
2 Fill in the host-defined text boxes.
3 Click Connect in the Test Dial-In Steps dialog box.
As soon as the call is answered, you can hear if audio is being broadcast.
4 Listen to the audio and then adjust the dialing sequence as necessary.
Note: If the provided free phone numbers are not the type of numbers recommended above, the dial out fails.
Delete an audio provider
1 Click the Administration tab at the top of the Connect Central window.
2 Click Audio Providers.
3 Select the provider in the Audio Providers list and click Delete.
Configure video telephony devices
Adobe Connect officially supports the Tandberg 990MXP and Edge 95 video conferencing devices; other Tandberg
H.264 devices should work similarly.
For more information, see the Tandberg website.
1 At the top of the Connect Central window, click Administration.
2 Click Video Telephony Devices.
3 In the Device Name box, enter the name you want users to see in the meeting client.
4 Enter the SIP (Session Initiation Protocol) Address defined for the device in the Flash Media Gateway server. (For
more information, contact your system administrator.)

175
USING ADOBE CONNECT 8
Administering Adobe Connect
Last updated 5/14/2013
5 Click Save.
Change the timeout period
To keep Adobe Connect Central more secure, you can change the length of time a session remains open without
activity. When the session reaches your specified timeout period, any unsaved data is lost.
1 At the top of the Connect Central window, click Administration.
2 Click Account.
3 Click Session Settings.
4 Enter a timeout length in minutes.
5 Click Save.
Creating and importing users and groups
Workflow for creating and importing users and groups
The following overview summarizes the workflow involved in setting up user accounts.
1. (Optional) Customize user profile fields.
A user profile field is an attribute of your organization’s Adobe Connect user profile. The fields for First Name, Last
Name, and e-mail are required and cannot be modified. However, you can add other predefined fields, create new
fields, and change their order in the user profile. See
“Customize user profile fields” on page 176.
2. (Optional) Set login and password policies.
You can set login and password policies, password expiration, password format, and password length. See “Set login
and password policies” on page 177.
3. Create custom groups.
Adobe Connect includes several built-in groups, see “Built-in permission groups” on page 189. You can also import
groups. If you need additional groups, you can create custom groups in Connect Central. It’s a good idea to create
custom groups first so you can add users as you import them to the account. See
“Create a custom group manually”
on page 180.
4. Add users and groups.
To add users and groups to Adobe Connect, use the Lightweight Directory Access Protocol (LDAP), comma-separated
value (CSV) files, or create users and groups manually.
Working with LDAP-acquired users and groups In LDAP-enabled organizations, Adobe Connect acquires all its user
data directly from the user directory of your organization. This data includes information such as login, name, and
phone number. You would probably not be involved in adding new users or groups to the system, because this process
occurs outside Connect Central. Once the LDAP integration is configured, manually assign LDAP-acquired users or
groups to the Built-in group appropriate for their job functions. For more information, see Migrating, Installing, and
Configuring Adobe Connect Server 7 available online at
www.adobe.com/go/connect_documentation_en.

176
USING ADOBE CONNECT 8
Administering Adobe Connect
Last updated 5/14/2013
Importing users and groups through CSV files You can import large numbers of users and groups through a CSV file.
Your directory might have a utility for exporting users and groups to CSV files, or you can create CSV files yourself.
Your CSV files must be in a specific format. You can modify the imported users and groups in the same way you would
any user or group that was manually created. See
“Import users and groups from CSV files” on page 178.
Adding users and groups manually You can assign new users to a Built-in group, or you can create custom groups that
are specific to your organization. It is best to create these groups before creating users manually. See
“Create a user
manually” on page 181 and “Create a custom group manually” on page 180.
5. Assign users to groups.
Once you have imported or created users and groups, set permissions so users can access content and create meetings,
trainings, events, or seminars. The Built-in groups have default permissions. Assign users and groups to the Built-in
groups as an easy way to set permissions. User account administration is simpler when you are managing groups rather
than individuals. See
“Add or remove group members” on page 185
Customize user profile fields
Add user profile fields to match the user profile fields in the directory of your organization.
When you customize user profile fields, you can add predefined fields, create custom fields, and remove fields. When
you modify a field, you can change any of its attributes. You can also designate a field as required, or add a comment
describing a field.
Note: Do not create multiple custom fields with the same name.
Include user profile fields
1 Click the Administration tab at the top of the Connect Central window.
2 Click Users And Groups.
3 Click the Customize User Profile link above the Users And Groups list.
The list of the user profile fields appears; First Name, Last Name, and E-mail are flagged with red asterisks (*) to
indicate that they are required.
4 Select the check box for any field on this page that you want to include as part of the user account profile.
5 To move an item up or down in the list, select its check box and click the Shift Up or Shift Down button.
The information in the user profile fields is displayed in reports. Reports display mandatory fields and the first ten
fields listed in the Customize User Profile screen. Use the Shift Up and Shift Down buttons to move fields into the
desired positions.
Add predefined fields
1 Click the Administration tab at the top of the Connect Central window.
2 Click Users And Groups.
3 Click the Customize User Profile link above the Users And Groups list.
4 Click the Add Predefined Field button.
5 Click the check box for any fields that you want to add.
6 Click Save.
7 To move an item up or down in the list, select its check box and click the Shift Up or Shift Down button.

177
USING ADOBE CONNECT 8
Administering Adobe Connect
Last updated 5/14/2013
Create custom fields
1 Click the Administration tab at the top of the Connect Central window.
2 Click Users And Groups.
3 Click the Customize User Profile link above the Users And Groups list.
4 Click the New Field button.
5 Type a name for this field.
If you want, you can type a comment in the Comment text input box. You can also select the Required check box for
the Field Type if you want this field to be required.
6 Click Save.
7 To move an item up or down in the list, select its check box and click the Shift Up or Shift Down button.
Modify user profile fields
1 Click the Administration tab at the top of the Connect Central window.
2 Click Users And Groups.
3 Click the Customize User Profile link above the Users And Groups list.
4 Click the name of the field that you want to modify to open it.
5 Do any of the following:
• Change the field name. (Although you can change it, you cannot delete it.)
• Type, change, or delete a comment in the Comment text input box.
• Select or deselect the Required check box for the Field Type.
6 Click Save.
Remove user profile fields
1 Click the Administration tab at the top of the Connect Central window.
2 Click Users And Groups.
3 Click the Customize User Profile link above the Users And Groups list.
4 Select the check boxes for the fields that you want to remove.
5 Click Remove.
6 On the remove confirmation page, click Remove to delete these fields, or click Cancel to cancel the operation.
Set login and password policies
Match the Adobe Connect login and password policies to the policies of your organization. Any policies you establish
are valid for all Adobe Connect applications.
1 Click the Administration tab at the top of the Connect Central window.
2 Click Users And Groups.
3 Click Edit Login And Password Policies and enter desired values.
4 Click Save.

178
USING ADOBE CONNECT 8
Administering Adobe Connect
Last updated 5/14/2013
To let hosts require alphanumeric passcodes for room access, click Enable Meeting Hosts To Enforce Passcode. (See
“Edit meeting information” on page 22.)
Import users and groups from CSV files
Before you import users, create a CSV file containing the users you want to add to Adobe Connect. The CSV file you
create must include user information in the following format:
Here are some additional tips for using CSV files:
• Because of browser limitations, if you have a large number of users to add, create several smaller CSV files instead
of one large CSV file.
• If the file contains empty lines, the import operation fails.
• Names that contain a comma must be in quotes. For example, the name John Doe, Jr., must appear in the CSV file
as “John Doe, Jr.”.
• The header format for custom fields is x-field-id (for example, x-45704960). To determine the field ID, in
Connect Central, select Administration
> Users and Groups > Customize User Profile. Click the field name. In the
browser address bar, locate the
filter-field-id parameter in the URL. The filter-field-id value is the
field-id. For example, for the custom field Cost Center, filter-field-id=cost-center, and the header
format is
x-cost-center.
Note: You can also obtain the field ID from the XML API calls custom-fields or acl-field-list.
• The user information in the CSV file must take login and password policies into consideration. For example, if an
e-mail address is used as the login name, the login and e-mail values in the CSV file must be identical. Or, if there
are password policies (certain length, format, special characters, and so on) these policies must also be applied in
the CSV file.
More Help topics
“Create a custom group manually” on page 180
“Setting permissions for library files and folders” on page 187
Create new users
1 Click the Administration tab at the top of the Connect Central window.
2 Click Users And Groups and then click Import.
3 Select Create New Users.
4 Under the Select File To Import bar, browse to the CSV file you want to import.
5 Click the Upload button.
first-name, last-name, login, email, password
Ron, Bloom, [email protected], [email protected], private1
Charles, Bond, cbond4,@mycompany.com, [email protected], private1
Jennifer, Cau, [email protected], [email protected], private1

179
USING ADOBE CONNECT 8
Administering Adobe Connect
Last updated 5/14/2013
If any errors occur, the first ten errors are displayed in red text. (Errors on duplicate user login/email are not reported.)
Make any necessary corrections and reimport the file; then repeat steps in this procedure.
Import users from a non-UTF-8 encoded CSV file
You can import users from a CSV file that isn’t UTF-8 encoded. When importing a non-UTF-8 encoded file, append
the appropriate encoding parameter to the import URL.
1 Click the Administration tab at the top of the Connect Central window.
2 Click Users And Groups and then click Import.
3 Check the URL in the browser address line. It looks like http://<Connect
Server>/admin/administration/user/import.
4 Click at the end of the URL in the browser address line and add “?encoding=<encode>” to the address. It looks like
http://<Connect Server>/admin/administration/user/import?encoding=<encode>. Specific examples include the
following:
• http://<Connect Server>/admin/administration/user/import?encoding=sjis
• http://<Connect Server>/admin/administration/user/import?encoding=euc_kr
5 After modifying the URL address, click Enter.
6 Select Create New Users.
7 Under the Select File To Import bar, browse to the CSV file you want to import.
8 Click the Upload button.
If any errors occur, the first ten errors are displayed in red text. (Errors on duplicate user login/e-mail are not
reported.) Make any necessary corrections and reimport the file.
Import groups from a CSV file
Use the group import option to import groups into the Connect database. After you import the group CSV file, you
can assign new users to the groups.
When you create the CSV file, ensure that it is in a format that Adobe Connect can use. The required column headers
in the CSV file are name and description. The following is an example of a group CSV file that is adaptable for Connect:
name, description
group1, test1
group2, test2
1 Click the Administration tab at the top of the Connect Central window.
2 Click Users And Groups.
3 Click the Import link above the list.
4 Under the Select Import Type bar, select the Create New Groups option.
5 Under the Select File To Import bar, browse to the CSV file that you want to import.
6 Click the Upload button.
If any errors occur, the first ten errors are displayed in red text. Make any necessary corrections and reimport the file;
then repeat steps
3-6.
7 If you assign users to custom groups, set library permissions for the groups. For more information, see “Setting
permissions for library files and folders” on page 187.

180
USING ADOBE CONNECT 8
Administering Adobe Connect
Last updated 5/14/2013
Import users and add them to a group
Use this option to import new users and add them to a Built-in or previously created group. The Built-in group names
appear in the menu for group selection as default groups. After you create a group manually, its name also appears in
the menu for group selection. You can use the import option to assign large numbers of users to multiple groups.
You can select only one group for the users you import from one CSV file. Create a different CSV file for each set of
users you want to add to a specific group. After you import these users, you can assign these users to additional groups,
or assign the whole group to another group.
The following example shows the minimum user information required for the CSV file. You can add other
information in the CSV file to prepopulate other user properties. The CSV file you create must include user
information in the following format:
1 Click the Administration tab at the top of the Connect Central window.
2 Click Users And Groups.
3 Click the Import link above the list of users and groups.
4 Under the Select Import Type bar, select Create New Users And Add Them To A Group.
5 Under the Select File To Import bar, browse to the CSV file that you want to import.
6 Click the Upload button.
Adobe Connect logs a message if groups in the CSV file exist in Adobe Connect.
7 Add the new users to a group. For more information, see “Add or remove group members” on page 185.
8 Set permissions for these users. For more information, see “Setting permissions for library files and folders” on
page 187.
Add existing users to a group
1 Click the Administration tab at the top of the Connect Central window.
2 Click Users And Groups.
3 Click the Import link above the list.
4 Under Select Import Type, click Add existing users to a group.
5 Select a group from the pop-up menu next to the Add existing users to a group option.
6 Under the Select File To Import bar, browse to the CSV file that you want to import.
7 Click the Upload button.
Create a custom group manually
Groups that you create manually are referred to as custom groups.
first-name, last-name, login, email, password
Ron, Bloom, [email protected], [email protected], private1
Charles, Bond, cbond4,@mycompany.com, [email protected], private1
Jennifer, Cau, [email protected], [email protected], private1

181
USING ADOBE CONNECT 8
Administering Adobe Connect
Last updated 5/14/2013
A group can contain both users and other groups.
1 Click the Administration tab at the top of the Connect Central window.
2 Click Users And Groups.
3 (Optional) To check that the group does not exist, enter its name in the Search text input box at the bottom of the
list.
4 Click the New Group button at the bottom of the list.
5 Enter the name and description of the new group.
6 Do one of the following:
• To add this group without adding members, click Finish.
• To add members, click Next.
7 In the Possible Group Members list, select each user and group that you want to assign to this group, as follows:
• To select multiple users or groups, press Control-click or Shift-click.
• To select individual names, double-click the group name. Double-click Up One Level in the list to return to the
original list.
• To search for a name in the list, click Search at the bottom of the list and enter the name.
8 Click Add.
To remove a name that you have added, select it and click Remove.
9 Repeat step 3 through step 8 for each group you want to add.
10 Click Finish.
11 Click the View Group Members button to review the group members and make any adjustments.
More Help topics
“Import users and groups from CSV files” on page 178
Create a user manually
When you add new users, enter a new password they can use to log in to Adobe Connect. This password is sent to the
user by e-mail. (There is an option you can select to prompt the user to change the password after they log in for the
first time.) You can also add audio conference settings for users.
After you create a user, you can select a manager for the user. (A user can have only one manager.) If the user you
created is a manager, you can assign the user team members. The manager can view report data for team members
using the Manager Reports option on the Home tab.
More Help topics
“Import users and groups from CSV files” on page 178
Create users
1 Click the Administration tab at the top of the Connect Central window.
2 Click Users And Groups.
3 Click the New User button at the bottom of the list.

182
USING ADOBE CONNECT 8
Administering Adobe Connect
Last updated 5/14/2013
4 Enter the last name, first name, and e-mail address. Add any optional information, such as company name or
address.
5 In the New Password text box, type a new password to mail to this user, and then retype it for confirmation. If the
user has an e-mail address, leave the E-mail The New User Account Information, Login And Password box selected.
If the user does not have e-mail, deselect it.
6 (Optional) In step 5 you provide a password for users to log in for the first time. To require users to change their
password after their first login, select the Prompt user to change password after next login option.
7 (Optional) Enter any audio conference settings in the appropriate text boxes.
8 To assign this user to one or more groups, click Next.
If you don’t want to assign this user to any groups, go to step 11.
9 In the Possible Groups list, select each group to which you want to assign this user as follows:
• To select multiple groups, press Control-click or Shift-click.
• To select individual names, double-click the group name. Double-click Up One Level to return to the original list.
• To search for a name in the list, click Search at the bottom of the window and enter the name.
10 Click Add.
11 Click Finish.
Add team members for a user
1 Click the Administration tab at the top of the Connect Central window.
2 Click Users And Groups.
3 Select the name of the user and click Information at the bottom of the list.
If necessary, click Search and enter the name of the user in the Search text box to locate the name in the list.
4 Click the Edit Team Members link to select team members for this user.
5 In the Possible Users list, select each team member you want to assign to this user as follows:
• To select multiple users, press Control-click or Shift-click.
• To search for a name in the list, click Search at the bottom of the window and enter the name.
6 Click Add.
To remove a team member you have added, select it and click Remove; to add more team members, repeat step 5 and
step
6.
Managing users and groups
Edit user information
If you are an administrator, you can modify the components of a user account. You can change any information you
added in custom user profile fields.
However, you cannot change a user password. Although you can assign a temporary password to a new user when you
create the user account, you cannot later change this password. Even if a user forgets the password, you cannot change
it. The user must click the “Forgot your password? Click here” link when logging in to Adobe Connect. No one can
change the password of another user; you can only change your own password.

183
USING ADOBE CONNECT 8
Administering Adobe Connect
Last updated 5/14/2013
Change user information
1 Click the Administration tab at the top of the Connect Central window.
2 Click Users And Groups.
3 Select the name of the user and click Information at the bottom of the list.
If necessary, click Search and enter the name of the user in the Search text box to locate the name in the list.
4 In the Login and Password area, you can use these options:
• To send a link to the user so that they can reset their password, click Send a link to reset this user’s password. A
message appears informing you that the e-mail was sent. Click OK to return to the User Information page.
• To set a temporary password for this user that you can provide directly (for example, by telephone), click the Set
temporary password for this user. The temporary password page appears with a system-generated password for this
user. Click Save to return to the User Information page.
5 Click the Edit Information link.
6 Edit any of the fields that you want to change.
7 Click Save.
Assign a manager to a user
1 Click the Administration tab at the top of the Connect Central window.
2 Click Users And Groups.
3 Select the name of the user and click Information at the bottom of the list.
If necessary, click Search and enter the name of the user in the Search text box to locate the name in the list.
4 Click the Select Manager link.
5 In the Possible Managers list, select the manager to whom you want to assign this user.
To search for a name in the list, click Search at the bottom of the window and enter the name.
6 Click the Set Manager button.
To remove this manager from list, select the name and click Remove Manager; to replace the manager, repeat step 5
and step
6.
Assign a user to a group
1 Click the Administration tab at the top of the Connect Central window.
2 Click Users And Groups.
3 Select the name of the user and click Information at the bottom of the list.
If necessary, click Search and enter the name of the user in the Search text box to locate the name in the list.
4 Click the Edit Group Membership link.
5 In the Possible Groups list, select each group to which you want to assign this user as follows:
• To select multiple groups, press Control-click or Shift-click.
• To expand a group so you can select individual names, double-click the group name. Double-click Up One Level
in the list to return to the original list.
• To search for a name in the list, click Search at the bottom of the window and enter the name.
6 Click Add.

184
USING ADOBE CONNECT 8
Administering Adobe Connect
Last updated 5/14/2013
To remove a group from this window, select it and click Remove.
Remove a user from a group
1 Click the Administration tab at the top of the Connect Central window.
2 Click Users And Groups.
3 Select the name of the user and click Information at the bottom of the list.
If necessary, click Search and enter the name of the user in the Search text box to locate the name in the list.
4 Click the Edit Group Membership link.
5 In the Current Group Membership window, select the group from which you want to remove this user as follows:
• To select multiple groups, press Control-click or Shift-click.
• To search for a name in the list, click Search at the bottom of the window and enter the name.
6 Click Remove.
Convert guests to full users or full users to guests
You can convert guests to full users or full users to guests. Full users can log into Connect Central; guests cannot. Full
users also appear on enrollment and permission lists. You might want to convert guests to full users if, for example,
you held an Event in which many guests registered that you would now like to turn into full users.
1 Select the Administration tab in Connect Central.
2 Select Users and Groups.
3 Click Manage Guests.
4 In the Current Guests list select a guest or in the Current Users list select a user.
5 Click Convert to User or Convert to Guest.
Delete a user account
If you are an administrator, you can delete any user account. Once the user account has been deleted, this user is
permanently deleted from the system and the following occurs:
• The user is removed from all group lists.
• The user is removed from the enrollee lists for all courses.
• Reports for the user are no longer available.
• If the deleted user was a manager, direct reports now have a blank manager field.
• If the deleted user created any content, assign another user to manage the content.
If the user is a member of a Built-in group, then the group is credited back one member. For example, if the deleted
user was a member of the Authors group, the Authors group can add a new user.
1 Click the Administration tab at the top of the Connect Central window.
2 Click Users And Groups.
3 If necessary, click Search and enter the name of the user in the Search text box to locate the name in the list.
4 Select the name of the user. (You can select multiple users by pressing Control-click or Shift-click to delete more
than one user simultaneously.)
5 Click Delete at the bottom of the list.

185
USING ADOBE CONNECT 8
Administering Adobe Connect
Last updated 5/14/2013
6 On the confirmation page, click Delete to delete the user, or click Cancel to cancel the operation.
More Help topics
“Delete a group” on page 186
View group information
1 Click the Administration tab at the top of the Connect Central window.
2 Click Users And Groups.
3 Select the group name and click Information at the bottom of the list.
If necessary, click Search and enter the group name in the Search text box to locate the name in the list.
4 Click the View Group Members button.
More Help topics
“Change a group name or description” on page 185
“Add or remove group members” on page 185
Change a group name or description
If you are an administrator, you can edit the name or description for any group— even Built-in groups, although
Adobe does not recommend this practice.
1 Click the Administration tab at the top of the Connect Central window.
2 Click Users And Groups.
3 Select the name of the group and click Information at the bottom of the list.
If necessary, click Search and enter the name of the group in the Search text box.
4 Click the Edit Information link.
5 Edit the fields you want to change.
6 Click the Save button.
Add or remove group members
If you are an administrator, you can add both users and groups to a group. You can also remove them.
Add members to a group
1 Click the Administration tab at the top of the Connect Central window.
2 Click Users And Groups.
3 Select the name of the group and click Information at the bottom of the list.
If necessary, click Search and enter the name of the group in the Search text box to locate the name in the list.
4 Click the View Group Members button.
5 In the Possible Group Members list, select each user or group that you want to add to this group as follows:
• To select multiple groups, press Control-click or Shift-click.

186
USING ADOBE CONNECT 8
Administering Adobe Connect
Last updated 5/14/2013
• To expand a group so that you can select individual names, double-click the group name. Double-click Up One
Level in the list to return to the original list.
• To search for a name in the list, click Search at the bottom of the window and enter the name.
6 Click Add.
To remove a user or group from this window, select it and click Remove.
Remove members from a group
1 Click the Administration tab at the top of the Connect Central window.
2 Click Users And Groups.
3 Select the name of the group and click Information at the bottom of the list.
If necessary, click Search and enter the name of the group in the Search text box to locate the name in the list.
4 Click the View Group Members button.
5 In the Current Group Membership window, select each user and group that you want to remove from this group,
as follows:
• To select multiple users or groups, press Control-click or Shift-click.
• To search for a name in the list, click Search at the bottom of the window and enter the name.
6 Click Remove.
Delete a group
If you are an administrator, you can delete any group except a Built-in group. Deleting a group does not delete
individual members of the group.
Before deleting a group, consider the impact on the permissions of the members and other groups. If the group was
granted permission to access files or folders in a library, the group members can no longer access those files or folders
(unless the members also belong to other groups with permissions for those files or folders).
1 Click the Administration tab at the top of the Connect Central window.
2 Click Users And Groups.
3 Select the name of the group. (You can select multiple groups by pressing Control-click or Shift-click to delete more
than one group simultaneously.)
If necessary, click Search and enter the name of the group in the Search text box to locate the name in the list.
4 Click Delete at the bottom of the list.
5 On the confirmation page, click Delete to delete the group; click Cancel to cancel the operation.
More Help topics
“Delete a user account” on page 184

187
USING ADOBE CONNECT 8
Administering Adobe Connect
Last updated 5/14/2013
Setting permissions for library files and folders
Administrators, limited administrators, and users with Manage permissions for a folder can set permissions for
working with content in Adobe Connect libraries. An administrator must design the permissions structure for an
account. Once the permissions structure is created, users with Manage permissions for folders in libraries can set
permissions for those folders.
More Help topics
“Working with library files and folders” on page 141
“Working with content in the Content library” on page 144
Workflow for setting permissions
To avoid listing and managing large numbers of users on the permission profile for a file or folder, use a group-based
permission system. Create your system as follows:
1. Design a permissions system using groups
You can give certain groups access to parts of the system as appropriate. To design your system, understand libraries,
groups, and permissions precedence. See
“Libraries” on page 187, “Built-in permission groups” on page 189, and
“Multiple permissions precedence” on page 192.
2. Create folders using descriptive names
Use names that describe the contents of the folder—for example, Human Resource Content, Product Support Content,
and so on. See
“Set permissions for content files and folders” on page 193.
3. Create custom groups using descriptive names
Use names that describe the permissions of the group—for example, Human Resource Content Managers, Shared
Content Viewers, and so on. See
“Create a custom group manually” on page 180.
4. Assign permission types for your groups to specific folders or files
For example, assign the Human Resource Content Managers group permission to manage the Human Resources
folder in the Shared Content folder. See
“Set permissions for content files and folders” on page 193.
5. Add users to groups
It’s easier to create groups first, then add users to whichever groups are necessary for them to obtain appropriate
permissions. See
“Add or remove group members” on page 185.
Permissions assigned to users take precedence over permissions assigned to groups. If you want to deny a user access
to certain folders, you can assign a user-based permission for those folders.
Libraries
The Content, Training, Meetings, Seminar Rooms, and Event Management tabs in Connect Central each contain a
library of files organized in folders. Files that you store in the Training, Meetings, Seminar Rooms, and Event
Management libraries are available for activities in those respective tabs only. Files in the Content library can be
accessed from all tabs in Connect Central.
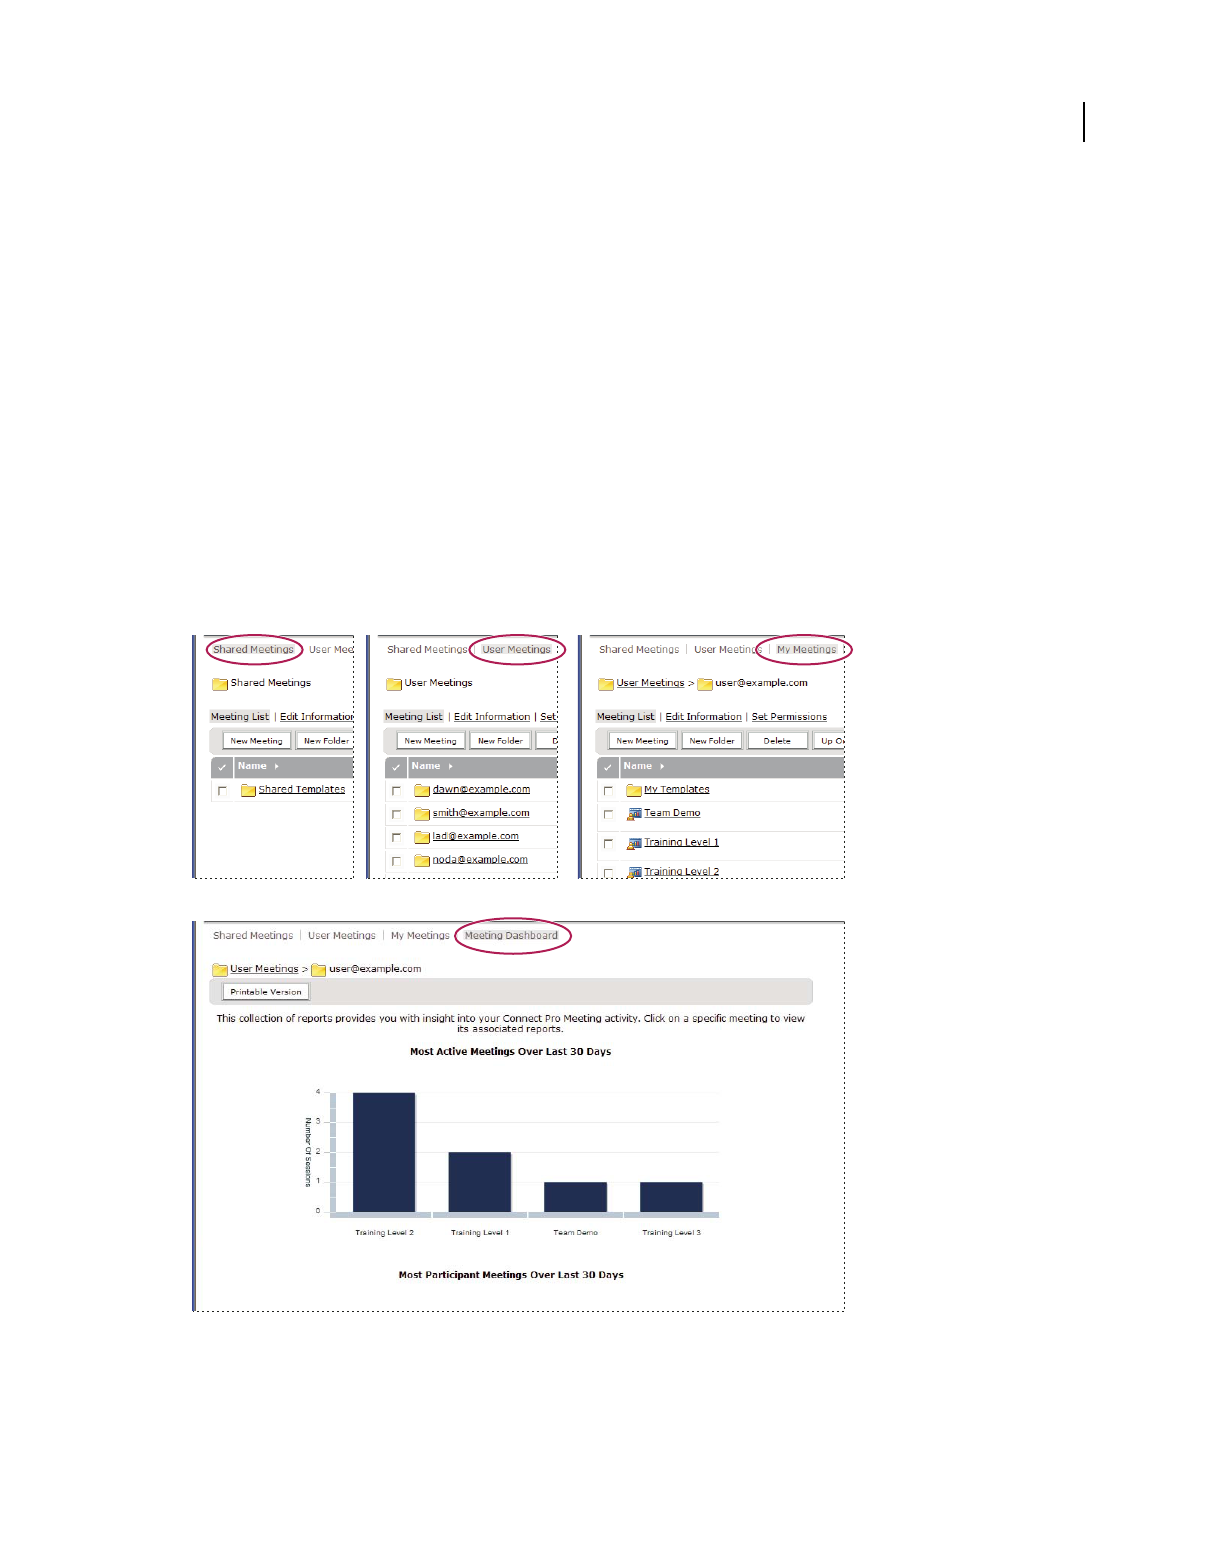
188
USING ADOBE CONNECT 8
Administering Adobe Connect
Last updated 5/14/2013
Administrators, limited administrators, and users with Manage permissions can set permissions to determine which
tasks each user can perform in the libraries.
Note: Administrators set permissions for limited administrators in the Administration > Users and Groups section of
Connect Central. By default, limited administrators can set permissions for content, but an administrator could choose
to revoke this ability.
Except for the Seminar library, each library has the following two top-level folders:
Shared Content When Adobe Connect is installed, only the administrator has access privileges to the Shared folders.
Administrators can assign permissions for the Shared folders in any way appropriate. Only members of the Built-in
group associated with that library can create new functions (meetings, events, and so on) in the folder. However,
Manage permissions for a Shared folder can be assigned to any user. For example, in the Meetings library, any user
with Manage permissions for a folder can manage the folder. Only meeting hosts can create new meetings in a folder.
User Content When a user is assigned to a specific Built-in group, Connect creates a user folder for that individual in
the associated library. For example, any users assigned to the meeting host group receive a folder in the User Meetings
folder in the Meetings library. It is this folder the user sees when accessing the Meetings tab. Users can manage their
own user folders, including setting permissions that give other users access privileges to the folders.
Libraries
A. Shared B. User C. My items D. Dashboard
A
D
B
C

189
USING ADOBE CONNECT 8
Administering Adobe Connect
Last updated 5/14/2013
Seminar library folders have a different structure. In the Seminar library, there are no user folders; instead, each folder
represents a different seminar license that your organization purchased. Users assigned to the Seminar Host group
have Manage permissions for all Seminar Rooms folders. Seminar hosts can add and delete seminars, assign Manage
permissions to other users, and create new seminars.
Built-in permission groups
Adobe Connect has eight built-in permission groups, each associated with a different library. Each member of a Built-
in group has a user folder in the corresponding library. Each member of the Meeting Hosts and Training Managers
groups also has a user folder in the Content library, and can author content for that folder.
You cannot change the permissions for these groups, but you can extend them by assigning individuals or groups to
more than one built-in group. In addition, the administrator can create custom groups and assign these groups
permissions for specific library folders.
There are eight built-in groups:
• Administrators
• Administrators - Limited
• Meeting Hosts
• Training Managers
• Seminar Hosts
• Event Managers
• Authors
• Learners
Each group reflects a specific set of access needs across all the libraries. There are groups for each purchased account
feature. For example, the Event Manager group only exists if the Events feature is part of the account.
Administrators assign users and groups to the appropriate Built-in groups. Members of a Built-in group can create
new instances of the function associated with that library. For example, if you are a meeting host, you can create new
meetings.
Members of a Built-in group cannot access the Shared folder directory of the library of the group unless you assign
them Manage permissions. You can also assign Manage permissions for a folder in the Shared folder directory to other
users who are not part of that Built-in group. Although they can manage folders, they cannot create anything in that
library, because they are not part of that Built-in group.
The following table summarizes the permissions each Built-in group has for each library:
Built-in group Content library Training library Meetings library Seminar library Events library Additional
permissions
Administrator Everything but
Publish
Manage Manage Manage Manage Manage users,
groups, and user
accounts; view
content folders for
all users
Author Publish/ Manage None None None None None
Learner None None None None None None
Training Manager Publish/ Manage
personal folder
Manage None None None None

190
USING ADOBE CONNECT 8
Administering Adobe Connect
Last updated 5/14/2013
Administrators group
Administrators have complete control of the entire Adobe Connect system. You can make any user an administrator
by adding them to the Administrator group. Permissions for members of the Administrator group cannot be
overridden by individual or other group permissions.
Administrators can perform the following actions:
• Manage the users and groups in the account, including creating, deleting, and editing them.
• Manage the Content library, including viewing, deleting, moving, and editing files or folders. View reports for files.
Set permissions for files or folders. Create new subfolders.
• Manage the Training library, including viewing, deleting, moving, and editing files or folders. View reports for files.
Set permissions for files or folders. Create new subfolders. Enroll users, send notifications to enrollers, and set up
course and curriculum reminders.
• Manage the Meetings library, including viewing, deleting, moving, and editing files or folders. View reports for
files. Set permissions for files or folders. Create new subfolders.
• Manage the Event library, including viewing, deleting, moving, and editing files or folders. View reports for files.
Set permissions for files or folders. Create new subfolders. Send invitations, and change content and e-mail options.
• Manage the Seminar library, including viewing, deleting, moving, and editing files or folders. View reports for files.
Set permissions for files or folders. Create new subfolders.
• View account information, account features, account quotas, and account reports. If your organization has
purchased this option, customize the Adobe Connect branding.
Limited administrators group
Limited administrators have limited control of the Adobe Connect system. You can make any user a limited
administrator by adding them to the Administrator - Limited group. Administrators can determine which permissions
limited administrators have.
Authors group
If you assign a user to this group, Adobe Connect creates a folder for this user in the User folder of the Content library.
(The shortcut called My Content points to this folder.) By default, a member of the Authors group has Publish and
Manage permissions only for the My Content folder.
Your account limits the number of users that you can add to the Authors group.
Members of the Authors group can perform all of the following actions if they have Publish permissions on the
specified folder:
• View content and content folders.
• Publish and update content.
•
Send e-mail messages containing links that send a notification to the author as soon as the recipient accesses the link.
Meeting Host Publish/ Manage
personal folder
None Manage None None None
Event Manager None None None None Manage None
Seminar Host None None None Manage None None
Built-in group Content library Training library Meetings library Seminar library Events library Additional
permissions

191
USING ADOBE CONNECT 8
Administering Adobe Connect
Last updated 5/14/2013
Training Managers group
Members of the Training Managers group are users who are responsible for organizing and coordinating training.
If you assign a user to this group, Adobe Connect creates a folder for this user in the User folder of the Training library.
(The shortcut My Training points to this folder.) By default, a training manager can manage only their folder in the
User Training folder.
A training manager can perform the following actions:
• Manage their own user folder in the Training library, performing all file-management functions, as well as create
and manage courses and curriculums, enroll users, send notifications to enrollers, and set up reminders.
• Have access to folders in the Content library.
• View training reports for the courses or curriculums that they created.
Event Managers group
Members of the Event Managers group can create events and manage their own folders in the Event library.
If you assign a user to this group, Adobe Connect creates a folder for this user in the User folder of the Event library.
Event managers can manage only their individual My Events folders in the User Events folder. Event managers can
manage events in the Shared folders if they are hosting the event and have Manage permissions for the folder that
contains the event.
An event manager can perform the following actions:
• Manage their own Event library user folder, performing all file-management functions, and create and manage all
aspects of an event in this folder.
• View event reports.
Meeting Hosts group
Members of the Meeting Hosts group create meetings.
If you assign a user to this group, Adobe Connect creates a folder for this user in the User folder of the Meetings library.
Meeting hosts can manage only their My Meetings folders in the User Meetings folder. Meeting hosts can manage
meetings in the Shared folders if they are hosting the meeting and have Manage permissions for the folder that contains
the meeting.
A meeting host can perform the following actions:
• Manage their User Meetings folder, performing all file-management functions, and create and manage meetings,
which involves adding, deleting, and assigning attendance permissions to presenters and participants. Create and
organize meeting rooms. Edit a meeting or change its participant list.
• View meeting reports.
• Create content.
• View content files and folders for which they have access permissions.
• Publish and update content.
Seminar Hosts group
Because of the way seminars are licensed, the permissions for seminar hosts are different from other groups.

192
USING ADOBE CONNECT 8
Administering Adobe Connect
Last updated 5/14/2013
Unlike other libraries, the Seminar library does not have a User folder. The Seminar library consists only of the Shared
folder, and each folder in this directory corresponds to a seminar license that your organization purchased. Only
seminar hosts and administrators can manage these folders. A seminar host can manage all the folders in the Seminar
library.
Seminar hosts can perform the following actions:
• Manage all Seminar library folders, performing all file-management functions, and create and manage seminars,
which involves adding, deleting, and assigning attendance permissions to presenters and participants; creating and
organizing seminar rooms; and editing a seminar or changing its participant list.
• View seminar reports.
About custom groups
Custom groups are groups that you create yourself. You can define specific folder and file permissions for the group
in the different libraries. You can assign permissions to a custom group by assigning it to the appropriate Built-in
groups.
For example, you could create a custom group called “Global” that contains a group for each country in which your
company has an office (for example, United States, Germany, and so on). Each country group could contain a group
for each office in that country (for example, San Francisco, Boston, and so on). Within each of these offices, you could
define more groups by job function, and then assign each of these groups the appropriate Built-in group designations.
In this example, you created a hierarchical set of groups called nested groups, because each group is contained by the
one above it in the hierarchy. By default, nested groups have the permissions of the parent group. You can expand or
restrict these permissions by setting custom permissions for these groups in the relevant libraries.
Multiple permissions precedence
If a user belongs to one or more groups, it is possible that multiple permissions apply to a single file or folder. In such
a case, permissions are resolved as follows (higher numbered levels take precedence):
Level 1 If the user has View, Publish, or Manage permissions through group-acquired permissions, the permission
granting the greatest access to features applies. These three group permissions are additive.
Level 2 If the user has any Denied permission through group-acquired permissions, all group-acquired View, Publish,
or Manage permissions are removed and the user is not allowed access.
Level 3 If the user has View, Publish, or Manage permissions through user-specific permissions, these permissions are
additive to the corresponding group-acquired permissions. In addition, these permissions override any group-
acquired Denied permission.
Level 4 If the user is assigned the Denied permission setting through user-specific permissions, the user is denied
access regardless of any group-acquired permissions.
Level 5 If the user is a member of the Administrator group, the administrator permission applies, regardless of any
other individual or group setting.
Level 6 If there are no permissions applied by either user or group (and none is inherited from a parent folder), the
user cannot access or perform any actions on the folder or file.
The following table illustrates the way that group and user permissions apply:

193
USING ADOBE CONNECT 8
Administering Adobe Connect
Last updated 5/14/2013
Set permissions for content files and folders
To customize the permissions list for a file or folder, you must be an administrator, a limited administrator, or a user
with Manage permission for that library file or folder.
Note: Administrators set permissions for limited administrators in the Administration > Users and Groups section of
Connect Central. By default, limited administrators can set permissions for content, but an administrator could choose
to revoke this ability.
1 Click the Content, Training, Meetings, Seminar Rooms, or Event Management tab in Connect Central.
2 Navigate to the folder or file and click its name to open it.
3 Click Set Permissions on the navigation bar.
4 Click Customization. (If the permissions for this item have been modified before, the Customization button does
not appear. Proceed to the next step.)
The Available Users and Groups pane displays users and groups for whom you can define permissions for the library
item. The Current Permissions pane displays users and groups who already have permissions for the library item. You
can change the existing permissions if desired.
5 To add a user or group to the Current Permissions pane, select the name in the Available Users And Groups list
and click Add.
Group G1 permissions Group G2 permissions Union (G1, G2)
permissions
User permissions Resulting permissions
View Publish Publish Manage Publish+Manage
Manage None Manage Publish Publish+Manage
Denied Publish Denied Manage Manage
View Manage Manage View Manage
Manage None Manage Denied Denied
None None None None None
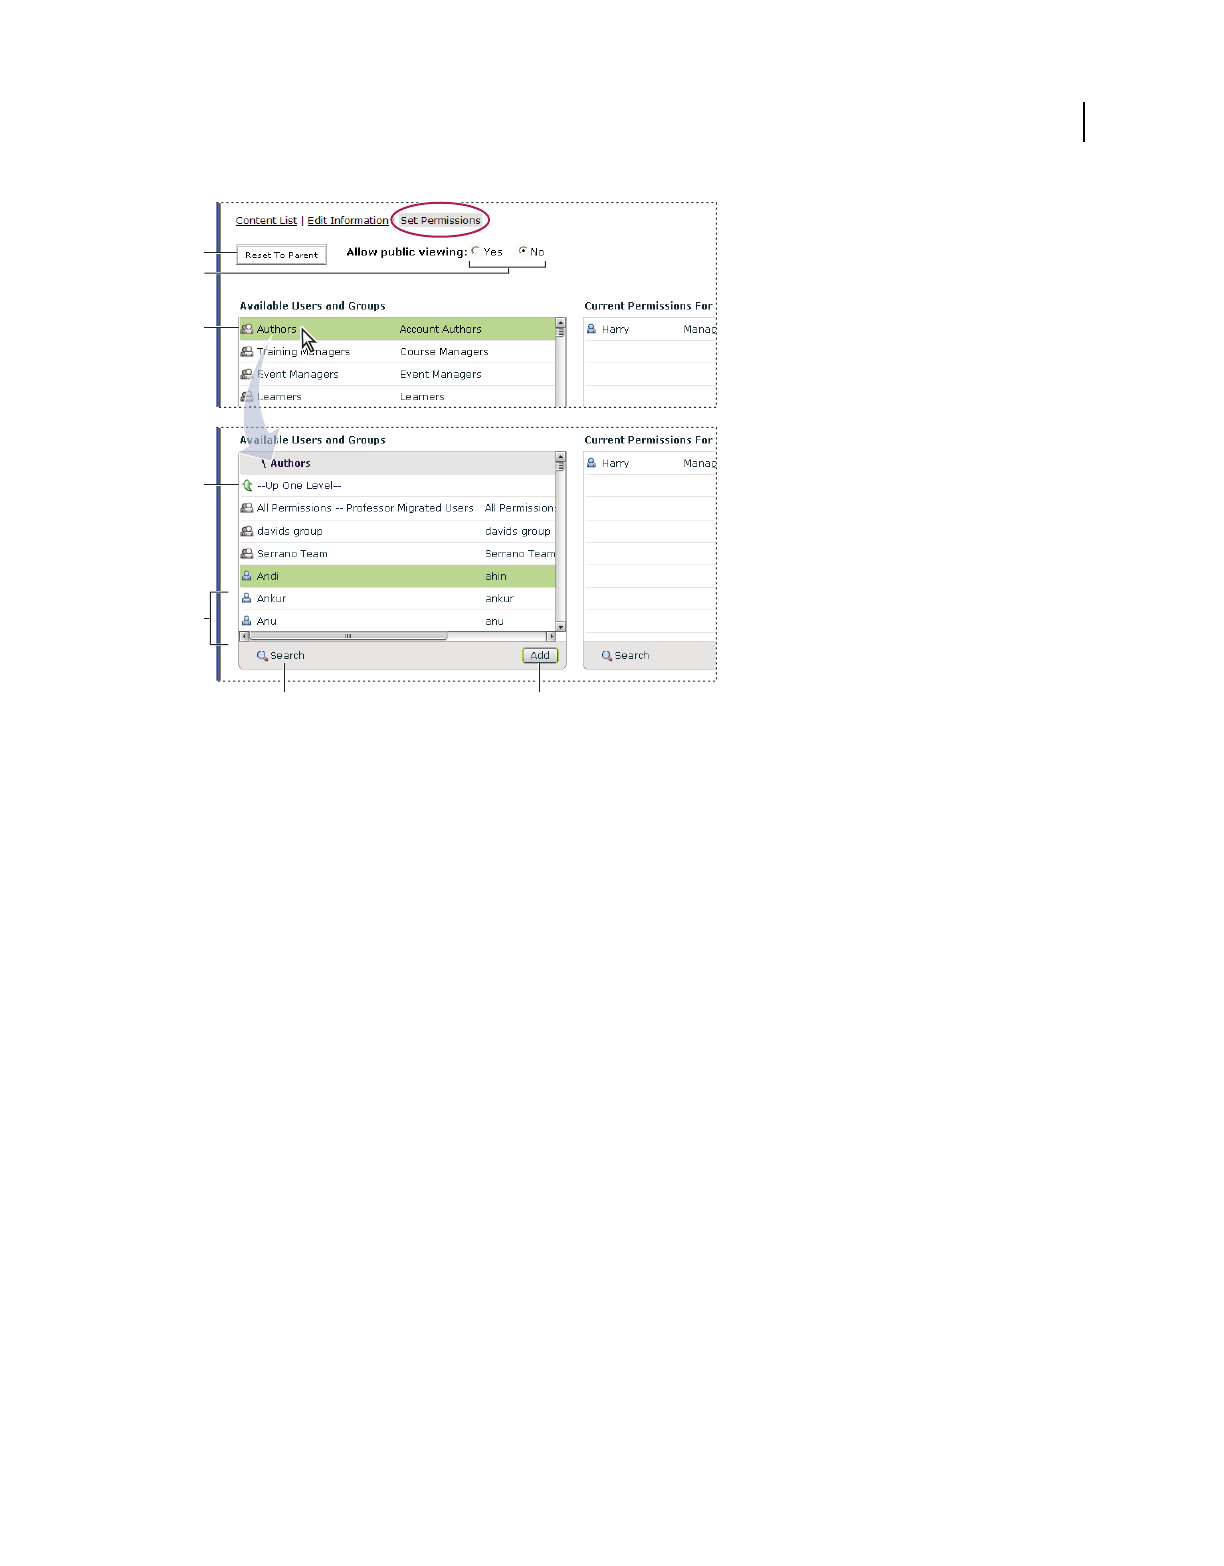
194
USING ADOBE CONNECT 8
Administering Adobe Connect
Last updated 5/14/2013
Setting permissions and navigating Available Users and Groups
A. Click to set folder or file permissions to be the same as the parent folder permissions B. Choose a viewing permission C. Double-click a group
name to view the users in that group D. Double-click the Up One Level icon to go up one folder level E. Users F. Click the Search button to
open a text box for searching G. Click Add to move a selected user or group to the Current Permissions list
6 To set the permissions for a user or group, select the name in the Current Permissions list and click Permissions.
7 Select one of the following permissions from the pop-up menu:
Manage Users or groups with Manage permission for a folder or file can view, delete, move, and edit the file or folder,
view reports for files in that folder, set permissions for the file or folder, and create new folders. However, they cannot
publish to that folder.
Denied Users or groups with a Denied permission setting for a folder or file cannot view, publish, or manage this
folder or file.
Publish Users or groups with a Publish permission setting for a folder or presentation can publish, update, and view
presentations, as well as view reports for files in that folder. However, these users must also be members of the Built-
in Author group, as well as have Publish permission, to publish content to this folder.
View Users or groups with a View permission setting for a folder or file can view any content in the folder, or can view
the individual file.
A
B
C
D
E
F G

195
USING ADOBE CONNECT 8
Administering Adobe Connect
Last updated 5/14/2013
Current permission settings
A. Selected name B. Click the Permissions button to select a permission setting. The setting is displayed next to the name.
8 To remove a user or group from the Current Permissions list, select the name and click Remove.
9 To reset permissions for the entire library folder or file to be the same as the permissions of the parent folder, click
Reset to Parent.
10 For Content library only: Select Yes for Allow Public Viewing to make this folder publicly viewable, even if the
parent folder is not publicly viewable. Select No to make the folder inaccessible to the public. Only Adobe Connect
users with View, Manage, or Publish permissions can view private content. To do so, they must first log in with an
Adobe Connect user name and password.
Generating reports in Connect Central
About Connect Central reports
The reporting feature in Connect enables you to quickly and easily obtain a wide variety of useful data about your
Connect installation.
The wizard-based interface lets you select a general type of report, and then make choices to specify exactly the
information that you need. For example, suppose you choose to create a course report. After selecting a course, you
view current enrollment details or view the entire enrollment history for the course. Another example is when you
create a meeting report, you view a summary of activity for one room over time. Alternatively, you view details about
one specific meeting session.
Information provided in system usage reports help you fine-tune your Connect installation and costs. For example,
you can obtain facts about system activity for a particular cost center.
Important general information about reports:
• If you have direct reports, click Manager Reports to see data about trainings completed, meetings attended, and
events attended for each direct report. Click the name of a direct report to list their direct reports.
• Groups cannot be used as a sort option. The groups column contains multiple values if a user is a member of
multiple groups. When a user belongs to more than one group and you sort by group, sorting only uses the first
group in the list. For information aggregated by group, use the Group report option where available, for example,
in the Learner and User reports.
• The default sort order for all reports that contain user names is by last name.
• Sort column information in ascending or descending order by clicking the column headers (except the group
column header).
A
B

196
USING ADOBE CONNECT 8
Administering Adobe Connect
Last updated 5/14/2013
• Add or remove column headers dynamically by selecting or deselecting “Select fields” in the Report wizard.
Note: If you upgraded from Adobe Connect Enterprise Server 6 to Adobe Connect Server 7, legacy training materials
migrated to the new server. However, the Adobe Connect Server 7 Reports wizard supports new data fields that are not
reported for legacy training materials. The new data fields appear blank. Also, the definitions of some fields in the new
reports may be slightly different from the fields offered in the old reports. For example, in the new reports the field
“enrolled” includes all enrolled users, but in the old reports it only included active enrolled users. For details about report
fields, see individual report descriptions in this document.
Working with reports
After you create a report, use the Report wizard to do any of the following:
• Click New or Cancel to return to the home page of the Report wizard.
• Click Edit Query or Previous to change filter and field settings.
• Click Save Report and give the report a descriptive name so you can access it from the Saved Queries module.
• Click Print to print the report.
• Click Download Report to save the report as a CSV file.
Accessing reports
Your access to reports is based on the groups to which you belong.
Creating custom fields in reports
Connect offers you the flexibility to customize reports. Through customization, you create reports that show you just
the information you want to see. You can eliminate columns of information you don’t require and add columns that
give you data you need. Refining reports makes your reports smaller in size and more useful.
When you customize a user profile, the top 20 fields appear and you can assign custom field priority. It is important
to prioritize custom fields in order of importance; reports include only the top 10 fields, including the e-mail custom
field.
For details about how to create custom fields, see “Customize user profile fields” on page 176.
Built-in group Report module permissions
Administrator All.
Limited Administrator System Usage, Saved Queries. However. administrators can remove access. See “Creating
administrators” on page 155.
Authors Content, Saved Queries.
Training Managers Content, Course, Curriculum, Virtual Classroom, Learner, Saved Queries.
Event Managers None.
Learners None.
Meeting Hosts Meeting, Saved Queries.
Seminar Hosts None.

197
USING ADOBE CONNECT 8
Administering Adobe Connect
Last updated 5/14/2013
Analyze a sample report
The following steps were taken to create the sample report:
1 Click the Reports tab at the top of the Connect Central window.
2 Click Curriculum.
3 Navigate to a specific curriculum, select the curriculum, and click Next.
4 On the left, click Specify Report Filters.
5 Select Filter Using A Date Range and enter dates.
6 Select Filter By User Group(s) and select a group.
7 On the left, select Add or Remove Report Fields.
8 Select additional fields, as desired.
9 On the left, select Options.
10 Under Choose Report Options, select Curriculum Report.
11 Click Create Report.
Sample report
A. Summary section B. Curriculum name C. Date filter D. Group filter E. Report options F. Detailed information about members of specified
group
The sample report shows the following information:
• The name of the curriculum is ABC Curriculum.
• The report was filtered to only show data from September 1, 2006 to October 1, 2008.
• The report was filtered to only show members of the group named Alphabet Group.
• The following information shows in the Summary section:
• In the selected group, there are 26 learners enrolled in the curriculum.
• Of the 26 enrolled learners, 4 have completed the curriculum.
• Of the 26 enrolled learners, 10 have completed some of the curriculum. They are reported as “Number in
Progress.”
B
C
D
E
F
A

198
USING ADOBE CONNECT 8
Administering Adobe Connect
Last updated 5/14/2013
• Of the 26 enrolled learners, 12 have not started the curriculum. They are reported as “Number not Started.”
• The following detailed information is listed below the Summary section:
• Last name of each learner from the specified group enrolled in the curriculum.
• First name of the learner.
• Status of the learner, such as Not Taken, In Progress, or Complete.
• If applicable, the certificate number for the learner. (The certificate number is a system-generated number and
unique ID that proves the learner completed the curriculum.)
• The version of the curriculum that the learner has used. (Update curriculums by making changes such as adding
learners or changing content. Some creators never update their curriculums, so there is one version only.)
• Date and time the learner last accessed the curriculum.
• The name of the group to which the learner is assigned. For our report, we specified that we only wanted to view
information about learners in the Alphabet Group, so we only see one group name listed.
After viewing the report, you have several options. To sort the information in different ways, click column headers.
For example, in the sample report, click Last Access to see which learners have accessed the curriculum recently. You
can also save, print, or download the report.
Using course reports
Course reports provide information about individual courses you created and the learners enrolled in the course. The
course report shows how a course is used. The report lists if the course is taken, how often it is taken, and if users pass,
fail, or complete the course. Course reports showing individual learners taking a specific course enable you to see who
has taken the course, their status, and their score.
The historical course report includes information about unenrolled and deleted users. Viewing data about unenrolled
and deleted learners helps you analyze how the course has been used over time. For example, you can see how many
learners have not completed the course and if that number is rising or falling.
Create course reports
1 Log in to Connect Central and click Reports.
2 Click Course.
3 Select a course from the Training library and click Next.
4 Click Specify Report Filters. (Optional) Enter a date range and/or select a specific User Group(s).
5 Click Add Or Remove Report Fields. Select and deselect the fields to display in the report.
6 Click Options. Select the course report to create: Course Report or Historical Course Report Which Includes
Unenrolled And Deleted Users
7 Click Create Report.
Read course reports
The table lists the specific information that appears in columns within course reports. All column headings do not
appear in all course reports.

199
USING ADOBE CONNECT 8
Administering Adobe Connect
Last updated 5/14/2013
Using curriculum reports
Curriculum reports show how learners use a curriculum and the courses and virtual classrooms in the curriculum. The
curriculum report lists summary information, such as how many learners are enrolled and how many are in progress.
The report also shows information about learners enrolled in the curriculum, including their name, status, and the last
time they accessed the curriculum.
The curriculum objects report lists information by learning objects, usually a course or virtual classroom. You can see
data such as the name of the learning object, the average learner score for the object, and if prerequisites are set.
Viewing curriculum object data can help you analyze how learners are using specific objects within a curriculum.
Create curriculum reports
1 Log in to Connect Central and click Reports.
2 Click Curriculum.
3 Select a curriculum from the Training library and click Next.
4 Click Specify Report Filters. (Optional) Enter a date range and/or select a specific User Group(s).
5 Click Add Or Remove Report Fields. Select and deselect the fields to display in the report.
Column heading Description
Attempts The number of attempts made to pass the course compared to number of attempts allowed. For example, 1 of
3 means that the learner made 1 attempt and a total of 3 attempts are available.
Certificate A system-generated number that proves the learner completed the course and provides the learner with a
unique ID. (Course status for a learner must be complete or passed to receive a certificate number.)
Date deleted Where applicable, the date the learner was deleted from the Connect Enterprise system.
Date enrolled Date the learner was added to the enrollment list for the course.
Date unenrolled Date the learner was removed from the enrollment list for the course.
First name First name of the learner enrolled in the course.
Group All groups this learner is a member of are listed here. This column does not sort.
Last access Last time the learner accessed the specific course.
Last name Last name of the learner enrolled in the course.
Manager The first and last name of the user’s manager.
Number complete Number of learners who completed the course.
Number enrolled Total number of learners ever enrolled in the course. Archival data is included.
Number failed Learners who failed the course.
Number in progress Learners who started, but not yet completed the course.
Number not started Learners who did not start the course.
Number passed Learners who passed the course.
Score Score the learner received for the course.
Status Where the learner is in the course workflow. For example, the learner has not opened the course (Not Started),
has opened, but not completed the course (In Progress), or has finished the course (Complete).
Version If multiple versions of the course were uploaded, this column states which version the learner used.

200
USING ADOBE CONNECT 8
Administering Adobe Connect
Last updated 5/14/2013
6 Click Options. Select the curriculum report to create: Curriculum Report or Curriculum Report Showing
Curriculum Objects.
7 Click Create Report.
8 (Optional) If you selected Curriculum Report Showing Curriculum Objects in step 6, click the name of any learning
object in the generated report. Clicking a name creates a report about the specific learning object.
Read curriculum reports
The table lists the specific information that appears in columns within curriculum reports. All column headings do not
appear in all curriculum reports.
Column heading Description
Active version If there are multiple versions of the curriculum object, the latest version is listed here.
Average score The average learner score for the curriculum object.
Certificate A system-generated number that proves the learner completed the curriculum and provides the
learner with a unique ID. (Curriculum status for a learner must be complete or passed to receive a
certificate number.)
Contents Description of curriculum object, such as presentation or Flash movie file.
First name First name of the learner enrolled in the curriculum.
Group All groups the learner is a member of are listed here. This column does not sort.
Last access Last time the learner opened the curriculum.
Last name Last name of the learner enrolled in the curriculum.
Learning object Name of the learning object.
Number complete Learners who have completed the curriculum.
Number enrolled Learners who have enrolled in the curriculum.
Number in progress Learners who have started, but not yet completed the curriculum.
Number not started Learners who have not started the curriculum.
Percentage complete Percentage of learners who have “Completed” status for the curriculum object.
Prerequisites Curriculum objects that must be completed before attempting the curriculum object listed on this
line.
Required or Optional States if learner must complete the curriculum object to complete the curriculum or if the object is
optional.
Status Where the learner is in the curriculum workflow. For example, the learner has opened the course (Not
Started), has opened but not completed the course (In Progress), or has finished the course
(Complete).
Test Outs Curriculum objects that can be completed instead of the object listed on this line.
Type Description of the curriculum object.
Version If multiple versions of the curriculum were uploaded, this column states which version the learner
used.

201
USING ADOBE CONNECT 8
Administering Adobe Connect
Last updated 5/14/2013
Using learner reports
Learner reports show all course, virtual classroom, and curriculum activity for an individual or group. The individual
learner report enables you to see how a learner is progressing through assigned training. Detailed information in the
report includes number of assignments given to the learner, number completed, number in progress, and number not
started. The group learner report shows similar information, but for an entire group instead of a single learner.
Learner reports are useful because they show details about how individuals and groups are using your courses and
curriculums. You can determine if learners are taking and completing training assignments, how quickly they are
working, and what scores they are receiving.
Create learner reports
1 Log in to Connect Central and click Reports.
2 Click Learner.
3 From the menu, select a Learner report type: Individual Learner or Group.
4 Select an individual learner or a group and click Next.
5 Click Specify Report Filters. (Optional) Enter a date range.
6 Click Add Or Remove Report Fields. Select and deselect the fields to display in the report.
7 Click Create Report.
8 (Optional) If you selected Individual Learner report in step 3, click the name of any learning object in the generated
report. Clicking a name creates a report about the specific learning object.
Read learner reports
The table lists the specific information that appears in columns within learner reports. All column headings do not
appear in all learner reports.
Column heading Description
Attempts Number of times the learner tried to complete the learning object. (Attempts are tracked at the learning object
level only.)
Certificate A system-generated number that proves the learner completed the course, virtual classroom, or curriculum and
provides the learner with a unique ID. (Course or curriculum status for a learner must be complete or passed to
receive a certificate number.)
Contents If the learning object is a course, the course content type is listed, such as presentation or image.
Last access For a curriculum, the date when any object within the curriculum was last accessed.
Learning object Name of the learning object.
Number complete Learners who completed the learning object.
Number in progress Learners who are still in progress with the learning object.
Number not started Learners who did not start the learning object.
Number of learning
assignments
Total number of assignments. If the learner is enrolled in a course outside a curriculum, and the course also exists
within the curriculum, the item is counted twice.
Score Score achieved on learning objects attempted to date.

202
USING ADOBE CONNECT 8
Administering Adobe Connect
Last updated 5/14/2013
Using content reports
Content reports provide detailed information about the content you have uploaded to Connect. (Content can be in the
following formats: PPT, PPTX, FLX, SWF, PDF, GIF, JPG, PNG, mp3, HTML, or ZIP.) For example, a content report
about a PDF shows page name, number of times each page was viewed, and last date each page was viewed.
A content report showing question details enables you to view information about questions in a presentation (PPT or
PPTX file). For example, you could select a presentation containing a question with five multiple choice answers.
Running a content report showing question details allows you to see how many learners picked each of the five possible
answers. This report is useful for refining the questions in your presentations. If you feel too many learners are passing
or failing a presentation, use this report to determine which questions to make easier or more difficult.
Create content reports
1 Log in to Connect Central and click Reports.
2 Click Content.
3 Select a piece of content from the library and click Next.
4 Click Specify Report Filters. (Optional) Enter a date range and/or select a specific User Group(s).
5 Click Add Or Remove Report Fields. Select and deselect the fields to display in the report.
6 Click Options. Select the type of content report to create: Content Report or Content Report Showing Question
Details.
7 Click Create Report.
Read content reports
The table lists the specific information that appears in columns within content reports. All column headings do not
appear in all content reports.
Status Where the learner is in the course/curriculum workflow. For example, the learner has opened the
course/curriculum (Not Started), has opened but not completed the course/curriculum (In Progress), or has
finished the course/curriculum (Complete).
Type Description of the learning object. For example, course, curriculum, or classroom.
Version accessed If multiple versions of the learning object were uploaded, this column states which version the learner used.
Column heading Description
Average score The average learner score for the content.
Content type Description of the content. For example, presentation, image, or SWF file.
Current disk usage Current size, in KB, of the content file.
Last modified date Last date that changes were made to the content file.
Last view date Last date that a user viewed the content file.
Maximum score Highest score a learner received on the content file.
Minimum score Lowest score a learner received on the content file.
Number of questions Total number of questions the content file contains.
Number selected Number of learners who selected this option.
Column heading Description

203
USING ADOBE CONNECT 8
Administering Adobe Connect
Last updated 5/14/2013
Using virtual classroom reports
Virtual classroom reports provide details about how virtual classrooms are being used over time. Use the Virtual
Classroom Report to see the names, enrollment dates, and completion status for learners in the classroom.
Use the Virtual Classroom Session Attendance Report to view data about a specific session within a virtual classroom.
You can see details such as session duration, total number of attendees, attendee names, and the times attendees
entered and exited. The information in this report helps you determine if the correct people attended a session and
how long they remained in the room. You can also compare different sessions. For example, suppose the same training
course is offered in the same virtual classroom at two different times. By running a session report for each time, you
can determine which one had higher attendance.
Create virtual classroom reports
1 Log in to Connect Central and click Reports.
2 Click Virtual Classroom.
3 From the menu, select a virtual classroom report type: Virtual Classroom Courses Report or Virtual Classroom
Session Attendance Report.
4 Select a virtual classroom from the Training library and click Next.
5 Click Specify Report Filters. (Optional) Enter a date range and/or select a specific User Group(s).
6 Click Add Or Remove Report Fields. Select and deselect the fields to display in the report.
7 Click Create Report.
Read virtual classroom reports
The table lists the specific information that appears in columns within virtual classroom reports. All column headings
do not appear in all virtual classroom reports.
Page name Full name of the page. (For PDF content only.)
Page number Number corresponding to the page number in the content file. (For PDF content only.)
Percentage selected Percent of learners who selected this option.
Question description The actual question from the question slide. For a multiple choice question, each possible choice is
listed on its own line.
Question number Number corresponding to the question number in the presentation.
Responses Different possible responses to the question.
Slide name Full name of the slide.
Slide number Number corresponding to the slide number in the presentation.
Total duration For movie or music file, the total length in hours/minutes/seconds of the file.
Total pages For a PDF, the total number of pages in the file.
Total slides For a presentation, the total number of slides in the file.
Total views The total number of times this content was viewed.
Unique views The number of uniquely identified viewers who accessed this content.
Column heading Description

204
USING ADOBE CONNECT 8
Administering Adobe Connect
Last updated 5/14/2013
Using meeting reports
Meeting room reports show how meeting rooms are being used. The Meeting Room Summary Report enables you to
get data about an individual meeting room over time and across sessions. You can obtain information including total
unique number of attendees, number of unique sessions, and average duration of a meeting. This information can help
you determine if meeting room activity is low. Conversely, if the report shows a meeting room is busy, you could create
more meeting rooms to better manage the workload.
Column heading Description
Assigned role Role as assigned on the manage enrollees page. (Does not show if role changed while in the virtual
classroom.)
Date deleted Date the learner was deleted from the virtual classroom.
Date enrolled Date the learner was enrolled in the virtual classroom.
Date unenrolled Date the learner was removed from the enrollment list for the virtual classroom.
Duration Length of the specific virtual classroom session selected.
Email E-mail address of the learner enrolled in the virtual classroom or the learner listed for the specific
virtual classroom session selected.
First entry time First time the learner entered the virtual classroom.
First name First name of the learner enrolled in the virtual classroom.
Last access Date when the learner last entered the virtual classroom.
Last exit time Shows the last time the learner exited the virtual classroom. (Learner may have entered and exited
multiple times.) Changing status to “stepped away” does not count as an exit. Only a lost connection
or a voluntary closure of the classroom window creates an exit time.
Last name Last name of the learner enrolled in the virtual classroom.
Multiple entrances logged Lists if learner entered and exited more than once during this session.
Number complete Learners who have completed the virtual classroom requirements.
Number in progress Learners who have logged in, but not yet completed the virtual classroom requirements.
Number not started Learners who have not logged in to the virtual classroom.
Participants attended Total number of learners who at least entered the classroom. Does not include any learners with
preassigned role of Host or Presenter.
Participants enrolled Total number of participants enrolled in the virtual classroom. This number does not include
participants assigned the Host or Presenter role.
Start time Time that the specified virtual classroom session selected began.
Status Where the learner is in the virtual classroom workflow. For example, if the learner has not entered the
classroom yet, their status would be Not Taken. When a learner exits a virtual classroom their status is
Complete.
Total attended Total number of learners who entered the specified virtual classroom session.
Total duration attended Total amount of time (sum of all time between each entrance and exit) the learner was actually in the
virtual classroom. If attendee was present from 11:45-12:00 and then 12:10-12:15, their total duration
would be 00:20:00.
Total enrolled Total number of learners enrolled in the specified virtual classroom session.

205
USING ADOBE CONNECT 8
Administering Adobe Connect
Last updated 5/14/2013
The Individual Meeting Session Report enables you to view information about a specific session within a meeting
room. You see details such as total number of attendees, total number of guests, and all attendee names. By comparing
planned duration to actual session duration, you determine if a meeting ended sooner or later than planned. The
information in this report also helps you determine if the correct people attended a specific meeting and how long they
stayed in the room.
Create meeting reports
1 Log in to Connect Central and click Reports.
2 Click Meeting.
3 From the menu, select a meeting report type: Meeting Room Summary Report or Individual Meeting Session
Report.
4 Select a meeting from the library and click Next.
5 Click Specify Report Filters. Optionally, enter a date range and/or select a specific User Group(s).
6 Click Add Or Remove Report Fields. Select and deselect the fields to display in the report.
7 Click Create Report.
Read meeting reports
The table lists the specific information that appears in columns within meeting reports. All column headings do not
appear in all meeting reports.
Column heading Description
Average duration The average length of meeting sessions that took place in this meeting room.
Average duration attended per
session
For the specific attendee, the average amount of time they spend in meetings in this meeting room.
Average users Across all sessions in this meeting room, the average number of attendees in a session.
Current disk usage (kb) Current amount of space, in KB, used by this meeting room.
Date of session The date this specific meeting session took place.
First entry time Time that the first attendee entered the meeting room for this specific meeting session.
First name First name of meeting attendee.
First session Date of the first meeting session that took place in this meeting room.
First session attended The date the specific attendee first attended a meeting session in this meeting room.
Intermittent activity Lists if attendee entered and exited more than once during this meeting session.
Last exit time Shows the last time the attendee exited the meeting. (The attendee may have entered and exited
multiple times.) Changing status to stepped away does not count as an exit. Only a lost connection or
voluntary closure of the meeting window creates an exit time.
Last name Last name of meeting attendee.
Manager The first and last name of the user’s manager.
Most recent session Date of the most recent meeting session that took place in this meeting room
Most recent session attended Date that this specific attendee last attended a meeting session in this meeting room.
Peak users Across all sessions, the highest number of attendees in the meeting room at the same time.

206
USING ADOBE CONNECT 8
Administering Adobe Connect
Last updated 5/14/2013
Using system usage reports
System usage reports show, from different perspectives, how your organization is using Connect. All of the reports can
be filtered by specifying a date range. Connect system administrators typically create and use system reports.
The system reports are different from each other and provide distinct data. First, you select a type of system report:
Individual Usage, Group Usage, Cost Center Usage, Full System Usage, or Burst Pack Usage. Then, you are given
specific options for the report you selected.
The Individual Usage report provides information about how a single user is interacting with Connect. The report
includes total meeting minutes, total trainings completed, and total storage consumption. The report helps you
determine how many meetings and training sessions a user has attended. The storage consumption number tells you
which individuals uploaded the most content.
The Group Usage report shows many details about a group of users. The top of the report lists summary information
about the group, including total number of members, total meeting minutes, and total consumption. The second
section of the report lists the individual members and data for each, such as total meeting minutes, login status, and
manager name. Run Group Usage reports for different groups to compare and see, for example, which groups are
using Connect the most and least.
The Cost Center Usage Report shows how members of a specific cost center are using Connect. One section of the
report lists individual members of the cost center and their system usage. Another section lists meetings billed to the
cost center and details, such as total number of attendees and meeting owner name. The Cost Center Usage Report
helps you track Connect minutes and costs. Run separate reports for different cost centers to compare their statistics.
The Full System Usage report provides a high-level summary of Connect usage. Optionally, filter the report by group
and/or by specifying a date range. System, meeting, and training summaries are provided on a single page. This report
is useful for telling management and other departments how your organization uses Connect.
Planned duration Time scheduled for the specific meeting session. (A meeting may be scheduled for one hour, but not
actually use the entire hour.)
Role on entry Attendee’s assigned role when they entered the meeting.
Total duration attended Adds up all the times in between each entrance/exit and compiles the total amount of time the
attendee was actually in the meeting. If the attendee was present from 11:45-12:00, and then from
12:10-12:15, their total duration would be 00:20:00
Total guests Total number of guest entries. (Cannot determine unique guests.)
Total hosts assigned Total number of attendees who entered the meeting with host status.
Total presenters assigned Total number of attendees who entered the meeting with participant status.
Total time in meeting room Total amount of time (sum of all time between each entrance and exit) the attendee was actually in
the meeting room. If attendee was present from 11:45-12:00 and then 12:10-12:15, their total duration
would be 00:20:00.
Total unique attendees Total number of separate, distinct attendees in the meeting room/session.
Total unique registered attendees Total number of separate, distinct registered attendees in the room/session.
Unique sessions Total number of separate, distinct meetings that took place in this meeting room.
Unique sessions attended Total number of separate, distinct meeting sessions this individual has attended
Column heading Description

207
USING ADOBE CONNECT 8
Administering Adobe Connect
Last updated 5/14/2013
The Burst Pack Usage Summary report lists how many burst pack minutes your organization is using. (Organizations
purchase burst pack minutes when they require more minutes in a particular time period.) The report also shows the
number of active rooms and the peak number of users. Use this report to control usage and costs of Connect.
Create system usage reports
1 Log in to Connect Central and click Reports.
2 Click System Usage.
3 From the menu, select a usage report type: Individual Usage, Group Usage, Cost Center Usage, Full System Usage,
or Burst Pack Usage.
4 Select an individual, group, or cost center and click Next.
5 Click Specify Report Filters. (Optional) Enter a date range.
6 For Individual usage, Group Usage, or Cost Center Usage reports, click Add Or Remove Report Fields. Select and
deselect the fields to display in the report.
7 Click Create Report.
8 (Optional) If you selected Cost Center Usage in step 3, click Download Report and choose a report to download as
a spreadsheet.
9 (Optional) If you selected Burst Pack Usage in step 3, you can show the report by Hour or Day.
Read system usage reports
The table lists the specific information that appears in columns within system usage reports. All column headings do
not appear in all system reports.
Column heading Description
Active login users Number of users in this group, cost center, or full system that are currently logged on the system.
Active room(s) Room(s) where overage minutes have been used.
Distinct meeting rooms Number of separate meeting rooms owned by the individual, group, cost center, or the full system. If
an individual has no host privileges, this number is zero.
End date Date and time when the meeting session tracked in the report ended.
First name First name of an individual user.
Group The name of the selected group. This column does not sort.
Last login date Last date and time the individual, member of group, or member of cost center logged in to Connect.
Last name Last name of an individual user.
Login status Current status of the user. For example, if the user is not currently logged in to Connect, their status is
Inactive.
Manager The first and last name of this user’s manager.
Meeting name Name of a meeting billed to the selected cost center.
Meeting owner email E-mail address of the person who created the meeting.
Meeting owner first name First name of the person who created the meeting.
Meeting owner last name Last name of the person who created the meeting.

208
USING ADOBE CONNECT 8
Administering Adobe Connect
Last updated 5/14/2013
View and download account summary reports
When you click the Administration tab, the Account Summary page appears. On this page, you can click the Reports
link to access several reports that summarize account information. Some reports are downloadable and others are not.
View Training Reports
1 Log in to Connect Central.
2 Click the Administration tab.
3 With Account selected, choose Reports.
Peak concurrent meeting users Highest number of people in meeting rooms at the same time for the full system. For example, if the
number is 100, 100 people is the largest number of people that were in meeting rooms at the same
time.
Peak users Highest number of users reached in room(s) where overage minutes have been used.
Start date Date and time when the meeting session tracked in the report started.
Storage consumption (kb) Current amount of space, in KB, used by the individual, group, or cost center. In the Full system report,
storage consumption numbers are listed for the entire system and for meetings.
Total attendees Total number of attendees when unique attendees from each session are added together. If the same
person attended two sessions, they are counted twice in this total attendees number.
Total burst pack minutes In the Cost Center Usage report, total burst pack minutes used by the entire cost center and for
individual meetings billed to the cost center. In the Burst Pack report, the total number of burst pack
minutes for the full system is listed.
Total host minutes (hh:mm:ss) Total number of minutes the individual, group, group member, cost center, or cost center member
spent in meeting rooms as a predefined host. Does not include host minutes when the user was
temporarily promoted to the host role. In the Full System Usage report, the total host minutes for the
entire Connect installation is listed.
Total hosts Total number of users with host status in the group, cost center, and full system.
Total learner training completions Total number of learners that completed courses and curriculums in the full system.
Total meeting minutes (hh:mm:ss) Total number of minutes, across all roles and sessions, spent within meeting rooms by the individual,
group, group member, cost center, or cost center member. The Full System Usage report shows total
number of meeting minutes across all users in the system.
Total meeting sessions Total number of individual meetings billed to the selected cost center.
Total training managers Total number of individuals in the Connect system with training manager permissions.
Total training storage consumption Total amount of storage (in KB) used for training objects, such as courses, curriculums., and virtual
classrooms.
Total trainings completed Total number of trainings (courses, curriculums, and virtual classrooms) completed by the individual,
group, member of group, cost center, or member of cost center.
Total unique training objects Total number of training objects (courses, curriculums, and virtual classrooms) in the full system.
Total users Total number of users in the group, cost center, or full system.
Type Type of meeting (classroom or meeting) billed to the cost center.
User storage consumption (kb) Total amount of storage space (in KB) the individual member of the cost center is using.
User total meeting minutes
(hh:mm:ss)
Total amount of time (in minutes) the individual member of the cost center has been in meetings.
Column heading Description

209
USING ADOBE CONNECT 8
Administering Adobe Connect
Last updated 5/14/2013
4 Click View Training Reports.
This report summarizes learner quota information (number of learners compared with the number allowed).
View Meeting Reports
1 Log in to Connect Central.
2 Click the Administration tab.
3 With Account selected, choose Reports.
4 Click View Meeting Reports.
This report shows the maximum number of attendees supported at one time (the concurrent peak) for the current
month compared with the allowable quota.
This report also shows the number of users currently participating in meetings, both live and recorded. You can use
this list to monitor meetings and click a meeting name to intervene. For example, to free up spaces for another meeting,
enter an active meeting and send the host a message requesting that some participants leave the meeting.
View Event Reports
1 Log in to Connect Central.
2 Click the Administration tab.
3 With Account selected, choose Reports.
4 Click View Event Reports.
This report shows the number of active (current) events for the account, and a list of the events. For each event, the
report shows the event name, number of registered users, event start date, and event completion date. You can click
the name of a specific event to open the Event Information page for this event and see more information. Some Event
reports, such as the attendee/absentee reports, are downloadable.
View and download Downloadable Reports
1 Log in to Connect Central.
2 Click the Administration tab.
3 With Account selected, choose Reports.
4 Click View Downloadable Reports.
5 Click Report Filters and choose how to filter the data that the report returns.
6 Click one of the Download Report Data buttons.
You can download five different kinds of reports as CSV files that you can export to external systems.
Note: Each downloaded report that you save is named “data.csv” by default. When you save the file, give it a unique
identifying name; for example, “interactionsMarch05.csv.”
Interactions downloadable report data
This report summarizes user access. A unique transaction ID is generated each time a user attends a meeting, attends
a seminar, views content, takes a course, or accesses a curriculum. The Interactions report presents the following data:

210
USING ADOBE CONNECT 8
Administering Adobe Connect
Last updated 5/14/2013
The Interaction report excludes certification numbers and max scores.
Users downloadable report data
This downloadable report lists users and associated profile attributes using data listed in the following table:
Data is generated in this view whenever a user creates, updates, or deletes a user.
If you select the Include Custom Fields option, custom information from user profiles is added to the report. When
customizing user profiles, there are three mandatory fields (first name, last name, and e-mail) and you can include up
to eight additional custom fields. To customize user profiles, choose Administration
> Users and Groups > Customize
User Profile. Move the eight additional fields you want to include to the top of the list.
The Users report excludes the following information:
• Password, which is not stored in plain text.
• Time zone and language, which are not available in human readable form; for example, PST is 323.
Note: Deleted users do not appear in the Users report. Deleted users continue to exist in the Interactions report.
Column name Description
transaction-id Unique ID for this transaction.
sco-id Unique ID used by Learning Management System (LMS) to identify different Shareable Content
Objects (SCO).
type Type of object accessed, such as content, meeting, or event.
name Object name as it appears in the content listing.
url Object that the user accessed.
principal-id Unique ID for the user.
login Name of user who accessed this transaction.
user-name Unique user name.
score The score of the user.
status Status of transaction: passed, failed, complete, or in-progress.
date-created Date this transaction occurred.
date-closed Date this transaction ended.
Column name Description
principal-id Unique ID for the user.
login Unique user identifier.
name Unique user name.
email E-mail address of the user.
manager The login of the manager of the user (manager is always set to NULL).
type User or guest (type is always set to user).

211
USING ADOBE CONNECT 8
Administering Adobe Connect
Last updated 5/14/2013
Assets downloadable report data
Data is generated in an Assets report whenever a user creates a meeting, event, seminar, curriculum, or course, or
uploads content. The report lists the following data on system objects (such as meetings, content, courses, and so on):
Questions downloadable report data
The Questions report lists responses to questions and quizzes from all the Adobe Connect applications. Data is
generated in this report whenever a user answers a quiz question in a course or curriculum, answers a registration
question, responds to a poll in a meeting or seminar, or adds a custom form to a meeting, seminar, course, or
curriculum. The report provides the following information:
If a question has multiple answers, each answer is presented in its own row.
The Question report excludes the following information:
• Correct or Incorrect, which can be determined by checking for a nonzero score
• Date answered, which does not exist in the version 410 schema
Slide Views downloadable report data
The Slide Views report describes the slides or pages viewed by Adobe Connect users. Report data is generated
whenever a user views content, a course, or a curriculum. The report provides the following data:
Column name Description
sco-id Unique ID used by Learning Management System (LMS) to identify different Shareable Content
Objects (SCO).
url Unique identifier for the object.
type Either a presentation, course, FLV file, SWF file, image, archive, meeting, curriculum, folder, or event.
name Object name as it appears in the content listing.
date-created Date on which the object is scheduled to begin.
date-end Date on which the object is scheduled to end.
date-modified Date this object was modified.
description Object summary information entered when a new meeting, content, course, or other object type is
created.
Column name Description
transaction-id Unique ID for this transaction.
question Text of the question.
response Response to the question.
score Number of points awarded for the response.
principal-id Unique ID for the user.
date-created Date the record was created.

212
USING ADOBE CONNECT 8
Administering Adobe Connect
Last updated 5/14/2013
Column name Description
transaction-id Unique ID for this transaction.
page Number of the slide or page that was viewed.
date-created Date of the viewing.
principal-id Unique ID for the user.

213
Last updated 5/14/2013
Chapter 8: Adobe Connect Desktop
Adobe Connect Desktop is an AIR application that lets you manage meetings and recordings locally, with or without
a web connection. If you work with large numbers of meeting rooms, attendees, and recordings, Adobe Connect
Desktop helps you manage them more efficiently.
To download Adobe Connect Desktop, visit www.adobe.com/go/learn_desktop_en.
Start Adobe Connect Desktop
1 From the Start menu (Windows) or Applications folder (Mac OS), start Adobe Connect Desktop.
2 Enter your server, user name, and password.
3 Select any of the following:
Secure login Encrypts data transmitted to and from secure servers (URLs beginning with https). Deselect this
option when using standard servers (URLs beginning with http).
Save password Automatically enters you password when you next start Connect Desktop.
Log in automatically Skips the login screen when you next start Connect Desktop.
To later deselect automatic log-in, click your user name in the upper-right corner of Adobe Connect Desktop.
Manage meeting rooms
1 In Adobe Connect Desktop, click Meetings.
2 In the Meeting Rooms area, do any of the following:
• Select an existing room to enter, delete, or edit. Click Advanced Settings to access the full range of settings in
Adobe Connect Central.
• Select Favorites to create a list of commonly used meetings for easy access. Click Add New Favorite, and search
for the meeting by name, description, or URL. Select the meeting from the list of results, and click Add To
Favorites.
Favorites can include meetings others own. If an owner deletes a meeting, however, the related favorite will no
longer work. To delete an outdated favorite, right-click it, and choose Remove From Favorites.
• Choose Create New Meeting or Refresh Meeting List from the pop-up menu .
Refreshing the list retrieves the latest meeting information from the server. (Adobe Connect Desktop
automatically refreshes the list each time you start it.)
For more details about editing or creating meetings, see “Edit meeting information” on page 22.
To quickly enter default and favorite meeting rooms, right-click the Adobe Connect Desktop icon in the system
tray (Windows) or dock (Mac OS).

214
USING ADOBE CONNECT 8
Adobe Connect Desktop
Last updated 5/14/2013
Create contact groups
1 In Adobe Connect Desktop, click Meetings.
2 In the Contacts area, click the pop-up menu , and choose Add New Group.
To remove a previously added group, right-click it in the Contacts list, and choose Delete.
3 Double-click the Working List title to give the group a custom name.
4 In the right pane, search for and add users to the group.
5 To add a group to a meeting, drag the group either to the Meeting Rooms list or to the Participants list for a selected
meeting.
Right-click in the Participants list to remove participants or change their role.
To add a group to a meeting, drag to Meeting Rooms list or Participants list
Add users to meetings or groups
1 In Adobe Connect Desktop, click Meetings.
2 In the Contacts area, do either of the following:
• Click Search to find any registered user.
• Click Recent to list users you’ve recently added to meetings or contact groups.
3 Right-click a user, choose Add To Meeting or Add To Group, and then select the specific meeting or group. (To
select multiple users, Shift-click.)
Information about selected users appears in the Contact Details area. To retrieve the latest information from the
server, click the Contacts pop-up menu , and choose Refresh Contact Data. (Adobe Connect Desktop
automatically refreshes contact data each time you start it.)

215
USING ADOBE CONNECT 8
Adobe Connect Desktop
Last updated 5/14/2013
Find recordings in Adobe Connect Desktop
1 In Adobe Connect Desktop, click Recordings.
2 Do any of the following:
• Click My Meetings, My Content, Virtual Classrooms, or Seminars to browse recordings stored in Adobe
Connect Central,
• Click Search Recordings to find recordings stored in Connect Central. Titles And Descriptions searches content,
meetings, training, seminars, and folders. Search Within Content searches recordings, courses, and
presentations.
• Click Local to navigate to recordings on your system.
3 Select a found recording, and either click Play to hear it, or Fetch to download the FLV file to your system.
If you click Fetch, a Downloads pane temporarily appears, showing the status of all active downloads. To stop a
download, right-click it, and choose Cancel.
Note: The Fetch option requires Adobe Connect 8 servers and is available only if the Connect administrator and
meeting owner have allowed recording downloads. For more information, see
“Customize compliance and control
settings” on page 163 and “Edit recording information” on page 139.
In the left pane, click Local to access downloaded recordings. Then click Play Local to hear the downloaded version,
or Play to hear the online one. (The two versions may differ if the meeting owner edits a recording.) If you want to
remove the local copy from your system, click Delete.
