
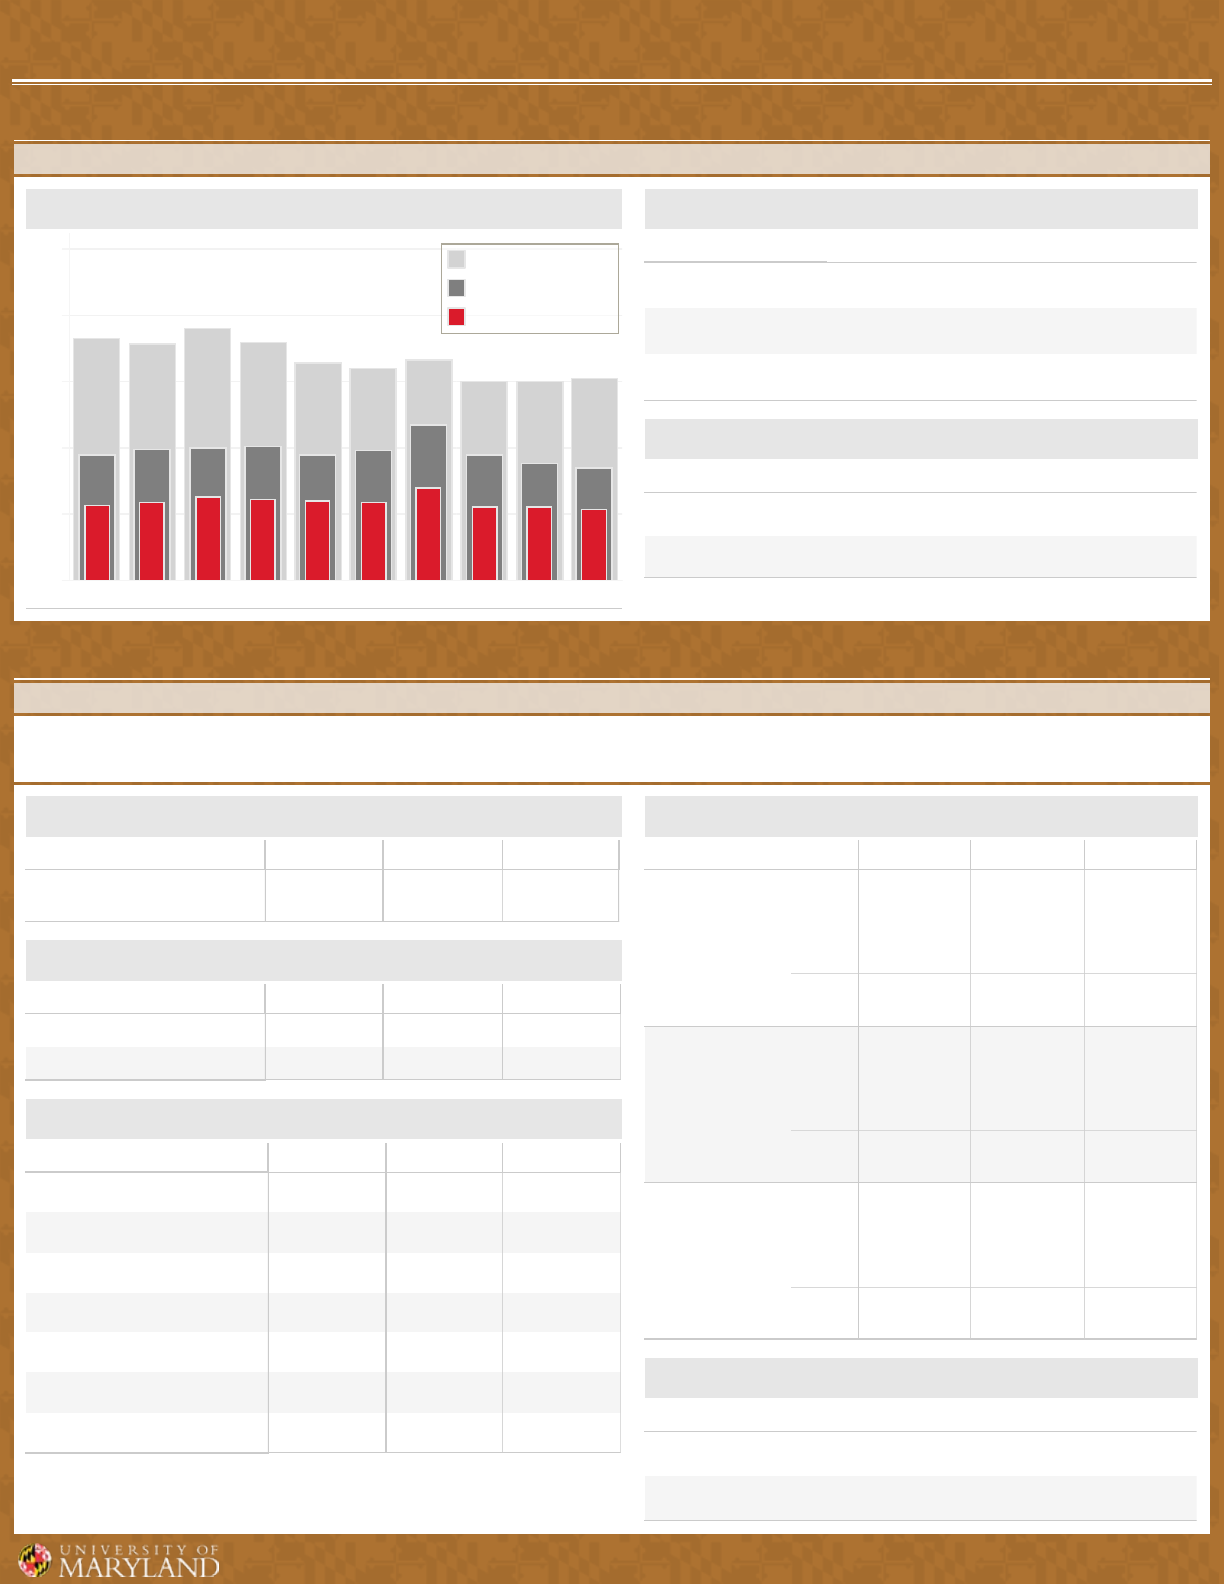
UMD NEW FIRST-TIME STUDENT APPLICATIONS
NEW FIRST-TIME APPLICATIONS
As defined by IPEDS,these are students who have no prior postsecondary experience and are attending an institution for the first time at the undergraduate
level. This group includes new freshmen, Freshmen Connection, and new Applied Agriculture students. Data prior to Fall 2021 represent only New Freshmen.
0K
20K
40K
60K
26.3K
28.4K
30.4K
34.0K
33.6K
33.1K
32.2K
50.3K
56.8K
59.5K
Applied, Admitted & Enrolled - Past 10 Years
Fall 2023Fall 2014
Fall 2021 Fall 2022 Fall 2023
Applications
Number Admitted
Number Enrolled
6,170
26,750
59,499
5,828
25,350
56,805
6,066
26,255
50,338
Applied, Admitted & Enrolled - Past 3 Years
Fall 2021 Fall 2022 Fall 2023
Admit Rate
Enroll Rate
23.1%
45.0%
23.0%
44.6%
23.1%
52.2%
Admit & Enroll Rates - Past 3 Years
Admit Rate: # Admitted/# Applications. Enroll Rate: # Enrolled/ #Admitted.
NEW FIRST-TIME STUDENT ENTRY STATS
The data in this section are limited to enrolled students entering the university as new first-time students. The new first-time student enrollment cohort in
Admissions reports will not match the new first-time student enrollment cohort in Enrollment reports. This is because some admitted students applied in a
previous semester, but elected to defer enrollment to a future semester.
FALL 2023: 6,170
FALL 2022: 5,828
FALL 2021: 6,066
Fall 2021 Fall 2022 Fall 2023
First Generation Students
31.3%
940
33.8%
1,017
34.9%
1,051
First Generation
Fall 2021 Fall 2022 Fall 2023
Freshman
Sophomore
Junior
Senior
Fr Connection
Applied Ag.
Special UG
0.1%
0.5%
19.4%
1.6%
9.9%
68.6%
4
31
1,174
95
598
4,164
0.1%
0.4%
18.2%
0.0%
2.2%
13.1%
66.0%
6
23
1,063
2
126
761
3,847
0.1%
0.6%
17.0%
0.0%
2.2%
16.7%
63.4%
7
38
1,049
2
133
1,031
3,910
Class Standing at Entry
Fall 2021 Fall 2022 Fall 2023
Students w/ Reported HS GPA
Avg High School GPA
4.45
5,883
4.43
5,634
4.34
5,893
Average High School GPA
Fall 2021 Fall 2022 Fall 2023
Students w/ Transfer Credits
Avg Transferred Credits
22.09
4,859
20.88
4,101
18.59
4,018
Average Transferred Credits
Fall 2021 Fall 2022 Fall 2023
Students w/ SAT Score
Students w/ ACT Score
Waived Test Score
3,187
441
2,527
2,647
443
2,728
3,422
562
2,075
Test Score Cohorts
Each student is reported once. If a student submitted both SAT and ACT scores, the
scores are compared and the highest score is used. This is the score used in the
admissions decision.
In recognition of the impacts of COVID-19, SAT and ACT scores were optional starting in
Fall 2021. This results in fewer SAT and ACT scores than previous years.
Fall 2021 Fall 2022 Fall 2023
SAT Total 25th
SAT Total 75th
SAT Total Midpoint
1445
1510
1380
1440
1510
1370
1420
1490
1340
SAT Scores
Fall 2021 Fall 2022 Fall 2023
ACT 25th
ACT 75th
ACT Midpoint
34
35
32
33
34
31
32
34
30
ACT Scores
Prepared by Office of Institutional Research, Planning & Assessment - October 2023
Enroll Type Param
NEW FIRST-TIME
Fiscal Yr
All
Student Group
New First-Time Students
Score Inclusion
One Score per Student
Applications
Number Admitted
Number Enrolled
New Freshmen Only
UMD NEW TRANSFER STUDENT APPLICATIONS
NEW TRANSFER & OTHER NEW UNDERGRADUATES
The data in this section looks at applications for transfer students as well as other new undergraduates.
0K
2K
4K
6K
8K
10K
7.3K
7.2K
7.6K
7.2K
6.6K
6.4K
6.7K
6.0K
6.0K
6.1K
Applied, Admitted & Enrolled - Past 10 Years
Fall 2023Fall 2014
Fall 2021 Fall 2022 Fall 2023
Applications
Number Admitted
Number Enrolled
2,130
3,381
6,097
2,226
3,540
6,017
2,216
3,773
5,991
Applied, Admitted & Enrolled - Past 3 Years
Fall 2021 Fall 2022 Fall 2023
Admit Rate
Enroll Rate
63.0%
55.5%
62.9%
58.8%
58.7%
63.0%
Admit & Enroll Rates - Past 3 Years
Admit Rate: # Admitted/# Applications. Enroll Rate: # Enrolled/ #Admitted.
NEW TRANSFER STUDENT ENTRY STATS
The data in this section are limited to enrolled students entering the university as new transfer students.
FALL 2023: 2,041
FALL 2022: 2,170
FALL 2021: 2,148
Fall 2021 Fall 2022 Fall 2023
First Generation Students
35.4%
738
32.4%
676
32.2%
671
First Generation
Fall 2021 Fall 2022 Fall 2023
Students w/ Transfer Credits
Avg Transferred Credits
53.67
1,817
54.39
1,940
54.94
1,969
Average Transferred Credits
Fall 2021 Fall 2022 Fall 2023
0 credits
30 credits or less
31-60 credits
61-90 credits
91-120 credits
121-150 credits
151+ credits
0.0%
0.2%
1.6%
37.1%
40.9%
11.8%
8.3%
1
5
34
797
878
254
179
0.2%
1.9%
32.8%
42.5%
11.9%
10.6%
5
42
712
923
258
230
0.0%
0.1%
1.4%
34.4%
40.4%
12.7%
11.0%
1
3
28
702
824
259
224
Transferred Credits at Entry
Figures reflect undergraduate's transfer credit which has been accepted at UMCP. This is
cumulative and reflects all transfer credit that has been accepted and posted to the student's
record. These may not be applicable to a student's degree program however.
Fall 2021 Fall 2022 Fall 2023
Four-Year
Institution
MD
Other
Total
Community
College
MD
Other
Total
Other Inst &
Foreign
MD
Other
Total
29.3%
18.0%
11.3%
630
387
243
31.7%
21.2%
10.4%
687
461
226
31.2%
20.7%
10.5%
636
422
214
68.5%
3.5%
64.9%
1,471
76
1,395
64.9%
3.2%
61.7%
1,408
69
1,339
65.4%
2.8%
62.6%
1,335
58
1,277
2.2%
1.4%
0.8%
47
30
17
3.5%
2.5%
1.0%
75
54
21
3.4%
2.2%
1.2%
70
45
25
Institution Type
Fall 2021 Fall 2022 Fall 2023
Students w/ Transfer GPA
Avg Transfer GPA
3.44
1,147
3.43
1,629
3.45
1,890
Average Transfer GPA
Prepared by Office of Institutional Research, Planning & Assessment - October 2023
Enroll Type Param
NEW TRANSFER
Fiscal Yr
Top 10 by MAX([Fiscal Yr])
Limit
All
SAT Student Group
New First-Time Students
Applications
Number Admitted
Number Enrolled
