
silabs.com | Building a more connected world. Copyright © 2022 by Silicon Laboratories Rev. 0.7
QSG175: Silicon Labs Direction Finding
Solution Quick-Start Guide
Bluetooth version 5.1 introduced support for Direction Finding to
provide a standard protocol for radio-based Real Time Locating
Systems (RTLS). Silicon Labs not only supports this feature in
its Bluetooth stack, but it also provides a reference
implementation of a Real Time Locating System running over
Bluetooth. This guide walks through the offered solution to help
anyone get started with Direction Finding.
KEY POINTS
• Stack support for Direction Finding
• RTL library
• Architecture
• Demos and Examples

QSG175: Silicon Labs Direction-Finding Solution Quick-Start Guide
Introduction
silabs.com | Building a more connected world. Rev. 0.7 | 2
1 Introduction
Bluetooth 5.1 introduced support for Direction Finding by adding the option to send and receive Constant Tone Extensions (CTEs) after
Bluetooth packets. This makes it possible to do phase measurements on antenna arrays and ultimately to determine the direction of an
incoming signal. To learn more about the theory of Direction Finding, that is how to determine the direction of incoming signals, see
UG103.18: Bluetooth® Direction Finding Fundamentals. Readers of this document should be familiar with the basics and terms of Direc-
tion Finding.
Beginning with Bluetooth SDK v3.1, Silicon Labs’ Bluetooth stack supports CTE transmitting and receiving features on selected devices
and can take phase measurements on the incoming signal as specified by the Bluetooth standard. Note, however, that the determination
of the angle of incidence from the phase measurements is outside of the scope of the standard and must be implemented in the applica-
tion. To reduce the Time to Market for its customers, Silicon Labs also offers a reference implementation of a Bluetooth-based Real Time
Locating System (RTLS), which provides both an out-of-box experience to evaluate the solution and a flexible framework that makes it
possible for everyone to create their own RTLS. To get started with the reference implementation, refer to AN1296: Application Develop-
ment with Silicon Labs’ RTL Library. To find the API Reference Manual for the RTL library, visit https://docs.silabs.com/
. The link for the
RTL library is under the Bluetooth section. To learn about the Simplicity Studio tools supporting Direction Finding, see UG514: Using the
Bluetooth® Direction Finding Tool Suite.
It is of course also possible for anyone to use their own direction-finding algorithm on top of the Bluetooth stack. This requires deep
knowledge in Direction Finding but enables even more flexibility. If you choose this approach, see AN1297: Custom Direction-Finding
Solutions using Silicon Labs’ Bluetooth Stack.
The Silicon Labs Direction Finding solution is part of the Bluetooth SDK. If you are not yet familiar with the Silicon Labs Bluetooth SDK,
start with the following document: QSG169: Bluetooth® SDK v3.x Quick-Start Guide
.
Finally, either you use Silicon Labs’ Direction Finding board or your own design. AN1195: Antenna Array Design Guidelines for Direction
Finding provides you with useful information regarding antenna design. It also provides accuracy measurement results of the RTL library
used with Silicon Labs’ Direction Finding board.

QSG175: Silicon Labs Direction-Finding Solution Quick-Start Guide
Demos and Examples
silabs.com | Building a more connected world. Rev. 0.7 | 3
2 Demos and Examples
Silicon Labs provides both hardware and software solutions to make the evaluation of the Direction Finding solution quick and easy.
Using a Direction Finding radio board along with a Wireless Starter Kit (WSTK) as a locator, and a Thunderboard BG22 as a tag, you can
easily set up our demo environment, which shows you the capabilities of Bluetooth-based Direction Finding.
To get started with Bluetooth demo software, you should have downloaded Simplicity Studio 5 (SSv5) and the Bluetooth SDK v3.x or
later as described in the Simplicity Studio 5 User's Guide
, available online and through the SSv5 help menu. The Bluetooth SDK comes
with some prebuilt demos that can be flashed to your EFR32 device and tested with the appropriate tool as described in this section. If
you are new to Silicon Labs’ Direction Finding solution, it is worth starting with setting up this demo.
2.1 Demo
• The demo comprises three demo applications:
• The Bluetooth AoA – SoC Asset Tag demo app is a prebuilt version of the sample app with the same name, and it is to be run on
the tag that you want to follow.
• The Bluetooth AoA – NCP Locator demo app is a prebuilt version of the sample app with the same name, and it is to be run on the
antenna array board (Direction Finding board).
• The AoA Analyzer tool is a Java based application, built into Simplicity Studio 5, that showcases the angle estimation skills of the
RTL library in a graphical user interface. It is intended for demo and evaluation purposes and follows a simple architecture as shown
in the following figure:
• Running the demo requires the following devices:
• An EFR32xG22 or an EFR32xG24 radio board, preferably a Thunderboard BG22
• A BRD4191A antenna array board with a WSTK Mainboard and with a Debug Adapter board
• A PC running Simplicity Studio 5 with Gecko SDK Suite v4.1.0 or later

QSG175: Silicon Labs Direction-Finding Solution Quick-Start Guide
Demos and Examples
silabs.com | Building a more connected world. Rev. 0.7 | 4
2.1.1 Set Up the Antenna Array Board
To set up the demo, first connect the antenna array board and install the proper firmware on it.
1. Attach the Antenna Array board to the Mainboard using the Debug Adapter board and a ribbon cable as shown in the following figure.
The Antenna Array board uses the Mini Simplicity+ connector (MINI+) to communicate with the Mainboard. Note: The MINI+ con-
nector is located on the back of the Antenna Array board. Flip the board after attaching the cable so that the antennas face upward.
2. Connect the mainboard to a PC using an USB cable or via Ethernet. Note: A USB connection is required, even if Ethernet is used
for communication, to power the board. Do not use a coin cell battery for this use case.
3. Make sure that the switch on the mainboard is set to ‘AEM’.
4. Start Simplicity Studio 5.

QSG175: Silicon Labs Direction-Finding Solution Quick-Start Guide
Demos and Examples
silabs.com | Building a more connected world. Rev. 0.7 | 5
5. Since the Antenna Array board is attached via the external debug connector of the mainboard, the board is not automatically recog-
nized. You must configure the mainboard into external debug mode.
1. In the Simplicity Studio 5 Launcher perspective’s Debug Adapters view, click the board to select it.
2. In the Launcher perspective’s Overview tab, on the General Information card, click Change next to Debug Mode. In the Device
Configuration’s Adapter Configuration tab, change the Debug Mode setting from ‘MCU’ to ‘OUT’ and click OK.
3. On the General Information card, click Configure next to Connected via. In the Device Configuration’s Device Hardware tab,
start typing “antenna array” into the Boards input field and select ‘BG22 Dual Polarized Antenna Array Radio Board (BRD4191A)’
from the list. Click OK.
6. Select the configured Antenna Array board in the Debug Adapters view and make sure that Gecko SDK Suite v4.1 (or later) is
selected as Preferred SDK. Go to the Example Projects & Demos tab.

QSG175: Silicon Labs Direction-Finding Solution Quick-Start Guide
Demos and Examples
silabs.com | Building a more connected world. Rev. 0.7 | 6
7. Filter for demos only and find the Bluetooth AoA – NCP Locator demo.
8. Click RUN to download and run the demo on your board. (Note: the demo also includes a bootloader. If you build the AoA locator
application from source, a bootloader must also be flashed to the device.)
2.1.2 Set Up the Tag
Next, install software on the board with an EFR32xG22 or EFR32xG24 part (the tag). Note: A precompiled demo is only available for the
Thunderboard BG22. For other boards, build the example project with the same name, and flash it to the device along with a bootloader.
These instructions are for the Thunderboard BG22.
1. Connect a Thunderboard BG22 to the PC.
2. Select the board in the Debug Adapters view, and make sure that Gecko SDK Suite v4.1 (or later) is selected as Preferred SDK.
3. Go to the Example Projects & Demos tab, filter for Bluetooth technology type and find the Bluetooth AoA – SoC Asset Tag demo.
4. If this is a new Thunderboard, push its reset button. On some boards the factory default firmware puts the device into EM4 sleep
mode after 30 seconds, so the device must be restarted before the programmer can load the demo.
5. Click RUN to download and run the demo.
2.1.3 Start the AoA Analyzer Tool
Finally, start the AoA Analyzer tool in Simplicity Studio 5.
1. In the Launcher perspective’s Debug Adapters view, right-click the antenna array board (Direction Finding board).
2. Select AoA Analyzer in the context menu. The tool is also available through the Tools menu in the Simplicity Studio toolbar.

QSG175: Silicon Labs Direction-Finding Solution Quick-Start Guide
Demos and Examples
silabs.com | Building a more connected world. Rev. 0.7 | 7
3. The analyzer opens, connects to the antenna array board, finds the asset tag near you, and displays its direction relative to the
antenna array board.
4. Move around the scene with your mouse to get a better view on the board.
5. Move the tag around, and see the right arrow following your movement:
6. Expand the Assets window in the lower right to see more information about the assets.
7. In the Settings window you can experiment with the AoX Mode. Different AoX modes provide different latency and different accuracy
of the angle estimation.
8. The application supports multiple tags, so if the Bluetooth AoA – SoC Asset Tag application is flashed to multiple devices, the AoA
Analyzer will display each direction with multiple arrows.
If the AoA Analyzer gets stuck after starting, try resetting the board. If that does not solve the problem:
1. In Simplicity Studio’s Debug Adapters view, right-click the antenna array board.
2. Select Connect.
3. Right-click the device again and select Launch Console.
4. Select the admin tab.
5. Check the serial vcom settings with the command
serial vcom
6. Change the serial vcom settings to use CTS handshake mode
serial vcom config handshake cts
7. Now re-try running AoA Analyzer. If it still does not work, upgrade the WSTK to the latest firmware version through the update
functionality on the Launcher perspective’s Overview tab.
2.2 Application Examples
As part of its reference RTLS implementations, Silicon Labs provides multiple sample apps that demonstrate the usage of the CTE
Transmitter and CTE Receiver features and of the RTL library.

QSG175: Silicon Labs Direction-Finding Solution Quick-Start Guide
Demos and Examples
silabs.com | Building a more connected world. Rev. 0.7 | 8
While the Demo is focusing on Angle of Arrival calculation only, the sample apps demonstrate both Angle of Arrival calculation and
position estimation, using multiple locators.
The sample apps follow the software architecture shows in section 4.1 Overview:
• The Bluetooth AoA – SoC Asset Tag sample app running on the tag demonstrates the CTE Transmitter feature.
• The Bluetooth AoA – NCP Locator sample app running on the antenna array board (target) is a modified version of the Bluetooth
- NCP example supporting the CTE receiver feature.
• The bt_aoa_host_locator host sample app running on the host demonstrates the CTE Receiver feature and the use of the angle
estimation feature of the RTL library. It uses the same application logic as the AoA Analyzer used in the demo setup.
• The bt_host_positioning host sample app running on the central device demonstrates the position estimation feature of the RTL
library.
• The bt_host_positioning_gui python script running on the central device visualizes the positions of the tags as calculated by the
positioning app.
• For detailed description of the sample apps, see AN1296: Application Development with Silicon Labs’ RTL Library.
2.3 Tools
Since setting up a full RTL system with multiple locators is not easy, Simplicity Studio also provides a set of tools that helps the developer.
The tools can be used for:
• Configuring the parameters of the individual locators and of the whole system,
• Running 3D demos (Angle of Arrival and Positioning),
• Analyzing the incoming and processed data.
To learn more about the tools, see UG514: Using the Bluetooth® Direction Finding Tool Suite.

QSG175: Silicon Labs Direction-Finding Solution Quick-Start Guide
Bluetooth Stack and SDK Support
silabs.com | Building a more connected world. Rev. 0.7 | 9
3 Bluetooth Stack and SDK Support
3.1 CTE Transmitter and Receiver
To support Direction Finding, Bluetooth 5.1 introduced the concept of Constant Tone Extension (CTE). CTE, as its name suggests,
extends the Bluetooth packets with a constant tone, that is with a continuous phase, constant amplitude and constant frequency signal,
sent immediately after the CRC of the Bluetooth packet. The length of this extension varies between 16 μs – 160 μs. This signal can be
used on the receiver side to measure the phase of the incoming signal on multiple antennas.
Figure 2-1. Bluetooth Package with CTE
To learn more about CTE, see the Technical Overview of Bluetooth Direction Finding published by the Bluetooth SIG:
https://www.blue-
tooth.com/bluetooth-resources/bluetooth-direction-finding/ and Bluetooth Core Specification v5.1 or later.
CTEs can be sent:
• Over Bluetooth connections using the Link Layer Constant Tone Extension Request procedure (connection-oriented mode).
• In periodic advertisements, if the CTEInfo field is present (connectionless mode).
Additionally, Silicon Labs provide a proprietary solution to send CTEs in extended advertisements (Silicon Labs enhanced mode), which
makes Real Time Locating Systems more scalable. This solution is highly recommended in a use case with hundreds of tags, as it is
stateless, in contrast to connections and periodic advertisement synchronizations which need to store sync information for each tag and
do not scale well.
To be able to send or receive CTEs, the CTE Transmitter and CTE Receiver software components must be installed in your Bluetooth
project, respectively.
These components initialize the cte_transmitter and cte_receiver BGAPI classes, and make it possible to use the associated APIs:
https://docs.silabs.com/bluetooth/3.1/group-sl-bt-cte-transmitter
,
https://docs.silabs.com/bluetooth/3.1/group-sl-bt-cte-receiver.

QSG175: Silicon Labs Direction-Finding Solution Quick-Start Guide
Bluetooth Stack and SDK Support
silabs.com | Building a more connected world. Rev. 0.7 | 10
Note: The CTE Transmitter feature is available on all EFR32xG22 and EFR32xG24 devices, including SoCs and modules. The CTE
Receiver feature is available only on part numbers marked with “Direction Finding” protocol stack support in the datasheet.
Typically a device is either in CTE transmitter or in CTE receiver mode, but not both. Install the corresponding software component on
each device.
To enable CTE responses on a connection, use the API
sl_bt_cte_transmitter_enable_connection_cte() on the CTE
transmitter side. To send a CTE request from the receiver to the transmitter, use the API
sl_bt_cte_receiver_enable_con-
nection_cte()
on the receiver side. If CTE responses are enabled on the transmitter side, the Bluetooth stack will automatically
respond to each CTE request with a CTE response.
To transmit CTEs in periodic advertisements, first start a periodic advertiser on the transmitter side (install the Periodic Advertising soft-
ware component and use the corresponding Bluetooth APIs), and then use the
sl_bt_cte_transmitter_enable_connec-
tionless_cte()
API to add CTE to the existing advertiser. To start listening to CTEs attached to periodic advertisements, first
establish a periodic synchronization on the receiver side (install the Periodic Advertising Synchronization software component and use
the corresponding APIs), and then use the sl_bt_cte_receiver_enable_connectionless_cte() API to enable CTE re-
ception on the established synchronization.
To transmit CTEs in Silicon Labs proprietary extended advertisements, first start a (regular) extended advertisement on the transmitter
side, and then use the API
sl_bt_cte_transmitter_enable_silabs_cte() to add CTE to the advertiser. To start listening
to CTEs attached to Silicon Labs proprietary extended advertisements, first start (regular) scanning on the receiver side and then use the
API
sl_bt_cte_receiver_enable_silabs_cte().
Every time a CTE is received on the receiver side, the signal is automatically sampled by the Bluetooth stack and an IQ report event is
generated by the Bluetooth stack. If you choose to use the reference RTLS implementation of Silicon Labs, you do not have to care about
these events. The IQ samples are forwarded to the RTL library, which then calculates the Angle of Arrival for you. If you choose to process
the IQ samples with your application, find more details about IQ samples in AN1297: Custom Direction-Finding Solutions using Silicon
Labs’ Bluetooth Stack.

QSG175: Silicon Labs Direction-Finding Solution Quick-Start Guide
Bluetooth Stack and SDK Support
silabs.com | Building a more connected world. Rev. 0.7 | 11
3.2 GATT Services
CTEs have parameters such as length, slot duration, and how often they should be sent. To make their configuration easy, the Bluetooth
SDK adds support for CTE configuration via the GATT database. This is especially useful in AoA mode on the asset tags (CTE transmit-
ters).
There are three CTE configuration services corresponding to the three CTE transmit mode (connection-oriented, connectionless, Silicon
Labs enhanced mode). To add these services to your project, install the corresponding software component:
The software components will not only add the service to the GATT database, but they will also take care of enabling, disabling and
configuring CTEs when the characteristics of the CTE service are written from a remote device. Note that the Connection oriented service
must always be installed when using any of the three software components. Connectionless and Silicon Labs enhanced services cannot
be installed at the same time.
3.3 Antenna Switching
Determining the direction of the Bluetooth signal is not possible without one device having an antenna array. As described in UG103.18:
Bluetooth® Direction Finding Fundamentals, in Angle of Arrival (AoA) mode the receiver must have an antenna array, while in Angle of
Departure (AoD) mode the transmitter must have an antenna array. In AoA mode the antennas must be switched during CTE reception,
while in AoD mode the antennas must be switched during AoA transmission. The Bluetooth stack supports both AoA and AoD mode, and
it controls antenna switches automatically during CTE transmission or reception. If you use Silicon Labs’ antenna array boards, you do
not have to care about switching pin configuration and antenna switching patterns, since they are implemented in the sample apps. If you
use a custom antenna array, details about the configuration are in AN1297: Custom Direction-Finding Solutions using Silicon Labs’
Bluetooth Stack.

QSG175: Silicon Labs Direction-Finding Solution Quick-Start Guide
Real-Time Location (RTL) Library
silabs.com | Building a more connected world. Rev. 0.7 | 12
4 Real-Time Location (RTL) Library
4.1 Overview
Estimating the Angle of Arrival (AoA) or Angle of Departure (AoD) from IQ samples is not trivial, especially in a real environment full of
reflections. To ease the burden for developers and to speed up time-to-market, Silicon Labs provides a Real Time Locating library (RTL
lib), which processes the IQ samples received from the Bluetooth stack, implements multipath detection and azimuth and elevation cal-
culation, and exposes the data to the application via an open API.
Figure 3-1: Silicon Labs RTL Library Providing Azimuth and Elevation
Furthermore, the library is also able to estimate the location of a tracked asset in a multi-locator scenario using triangulation, where
multiple locators receive CTEs from the same asset tag, provided that the library knows the position of each locator. In this case the
positions of the locators and the estimated angles (AoA) serve as the input, and the estimated location is the output.
Figure 3-2: Silicon Labs RTL Library Providing X, Y and Z
QSG175: Silicon Labs Direction-Finding Solution Quick-Start Guide
Real-Time Location (RTL) Library
silabs.com | Building a more connected world. Rev. 0.7 | 13
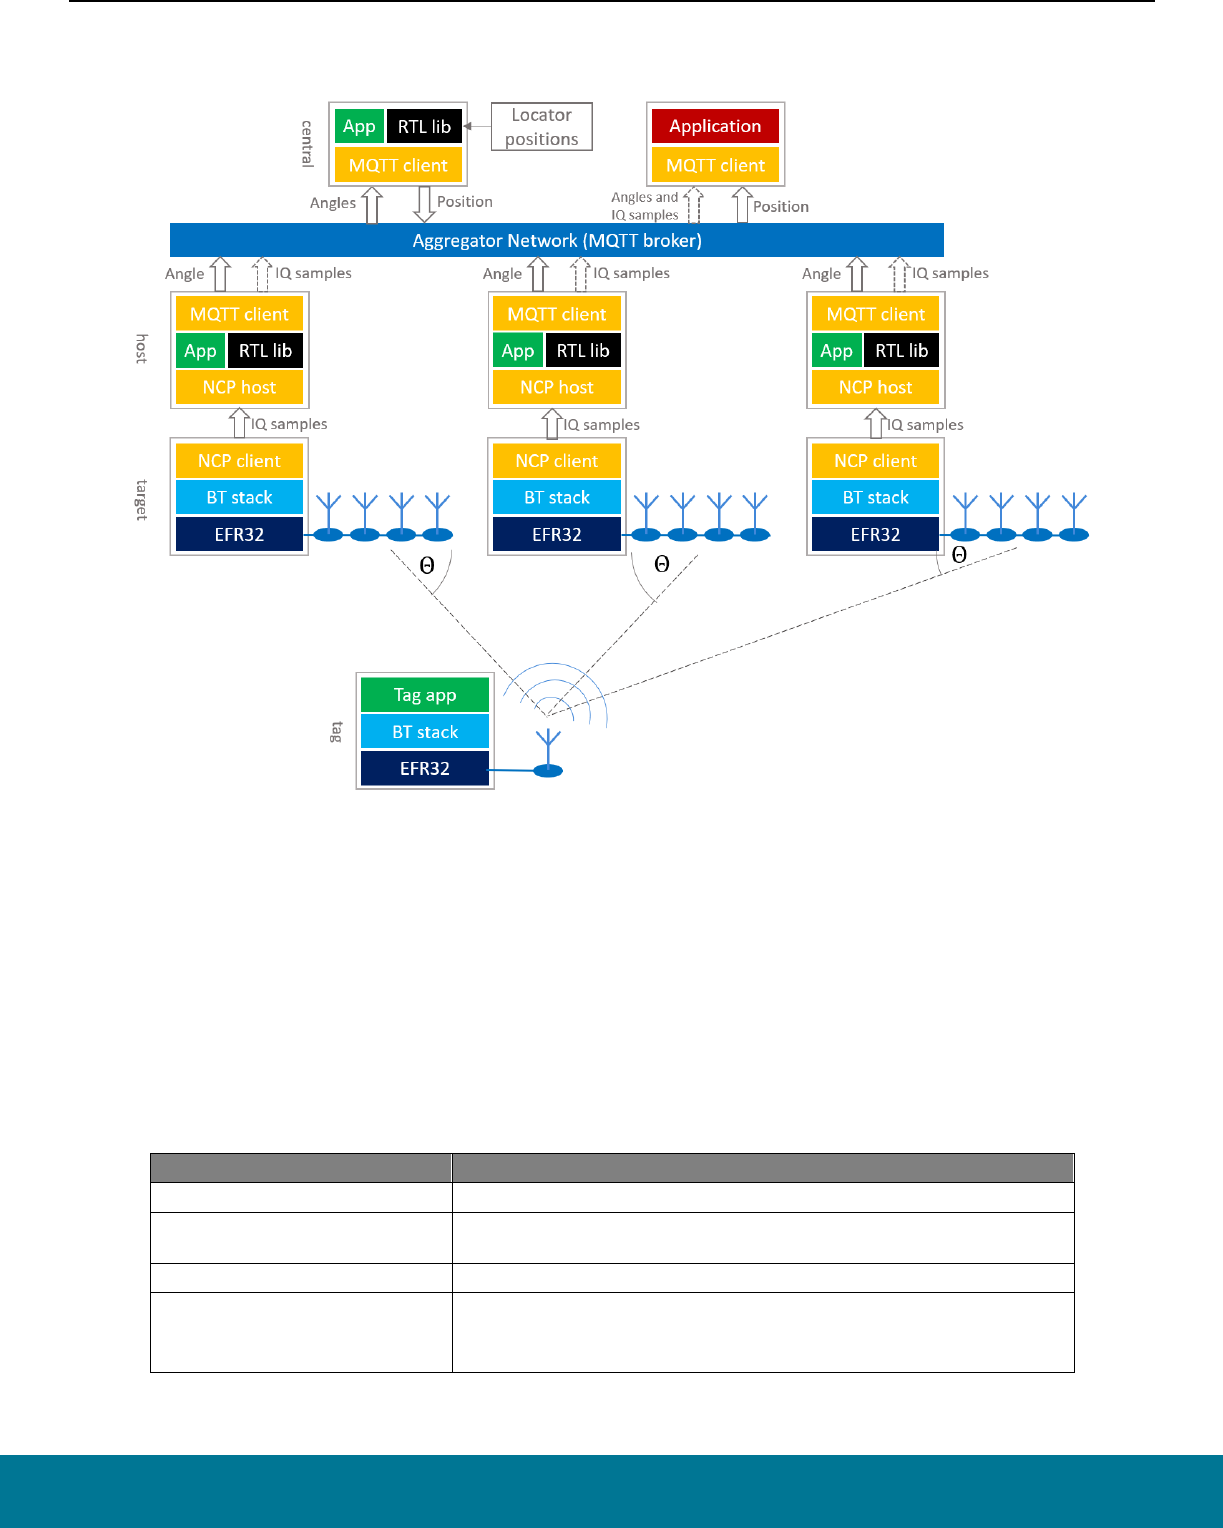
Once the positions are estimated it is up to the user’s application how to process the data. The general architecture of an RTLS using
Silicon Labs RTL library looks like this:
All AoA-related sample apps in the Bluetooth SDK are created so that they support this model. To learn more about the sample apps,
see AN1296: Application Development with Silicon Labs’ RTL Library.
Note that on the Locator side the devices work in a Network Co-Processor (NCP) mode, that is, the stack runs on the EFR32 chip, but
the application runs on a host computer. Currently, due to the limited computational capacity of the EFR32 chips, only NCP mode is
supported, that is the RTL library cannot be used on the chip. To learn more about NCP mode, see AN1259: Using the v3.x Silicon Labs
Bluetooth® Stack in Network Co-Processor Mode.
The locators can connect to the central PC in many ways. Silicon Labs’ reference implementation uses MQTT to collect angle data from
locators, since it gives the flexibility to run the host sample apps on a distributed network as well as on a single PC using localhost, but
other implementations can be used as well.
The RTL library provides the following features:
Feature
Value and Comments
Direction Finding Method AoA
# of tags supported
infinite (lib needs to be initialized for each, and physical channel puts a
limitation on this)
# of locators supported infinite (lib needs to be initialized for each)
Antenna arrays supported
BG22 Dual Polarized Antenna Array Radio Board (BRD4191A),
EFR32BG22 Direction Finding Radio Board (BRD4185A),
CoreHW PCB4 and PCB8 Antenna Array boards

QSG175: Silicon Labs Direction-Finding Solution Quick-Start Guide
Real-Time Location (RTL) Library
silabs.com | Building a more connected world. Rev. 0.7 | 14
Feature
Value and Comments
Modes of operation
Single shot / Real time,
Fast response / Basic / High accuracy
Azimuth & elevation / Azimuth only
Supported platforms Windows x64, Ubuntu x64, Raspbian (Cortex A), Darwin x64
The RTL library is provided as a single static library for each supported platform. The library can be found in the Gecko SDK suite under:
• GSDK 3.x: C:\SiliconLabs\SimplicityStudio\v5\developer\sdks\gecko_sdk_suite\v3.1\util\silicon_labs\aox
• GSDK 4.0 and higher: C:\Users\<username>\SimplicityStudio\SDKs\gecko_sdk\util\silicon_labs\aox
The library has three API classes:
• Angle of Arrival / Departure (sl_rtl_aox_): API used for AoA/AoD estimation from IQ samples. (Currently only AoA is supported.)
• Location Finding (sl_rtl_loc_): API used for location estimation (x, y, z coordinates) from AoA/AoD.
• Utility Functionality (sl_rtl_util_): API grouping utility functions that may be useful during AoA/AoD/location estimation
Inside the Angle of Arrival / Departure and Utility Functionality classes an IQ Sample Quality Analysis API is also available to provide
analytical measurements of different kind of errors in the system.
4.2 Angle of Arrival / Departure
There are two Bluetooth based direction-finding methods: Angle of Arrival (AoA) estimation and Angle of Departure (AoD) estimation.
Currently the RTL library supports AoA mode only. In this mode, the transmitter transmits a constant tone on a single antenna, and the
receiver receives this signal on multiple antennas. Based on their spatial situation, the receiver antennas will receive the same signal with
different phase offsets, from which the direction of the incoming signal can be estimated.
While it is easy to estimate the Angle of Arrival in an environment free of noise and reflections, it can get quite challenging in a noisy real-
world environment with a lot of reflections. To mitigate the effects of reflections, the RTL library uses different methods, such as spatial
and temporal filtering, averaging over multiple frequencies, and so on.
4.2.1 Antenna Configuration
The estimator algorithm must know the exact position of each antenna in the array, and the phase of the incoming signal for each antenna.
Currently the RTL library only supports some antenna array boards with pre-defined antenna positions. When running the RTL library,
the antenna array board must be specified so that the library knows which predefined values to use. Custom antenna array configuration
is not yet available. The default antenna array board set in the sample applications is BRD4191A.

QSG175: Silicon Labs Direction-Finding Solution Quick-Start Guide
Real-Time Location (RTL) Library
silabs.com | Building a more connected world. Rev. 0.7 | 15
4.2.2 Angle Estimation Modes
The library provides different modes for different use cases:
One Shot / Real Time modes
In “one shot” mode the angles are always calculated from the latest measurements without any a priori knowledge or assumptions
about the direction of the transmitter. On the other hand, in the “real time” mode the library keeps account of the latest angle estimation
and tries to find the transmitter in the vicinity of the last direction.
Fast Response / Basic / High Accuracy modes:
In “fast response” mode the estimator uses fewer measurements to provide one estimation. This results in a fast response but can
result in a poor accuracy. On the contrary, “high accuracy” mode uses more measurements, which results in higher latency, but much
better accuracy. Basic mode is a trade-off between fast response and high accuracy. For details see the RTL API Reference.
Azimuth & Elevation / Azimuth Only modes:
By default the RTL library calculates both azimuth and elevation angles. In some use cases, however, it is enough to calculate the
azimuth angle. “Azimuth only” mode results in faster calculation.
These modes are used together to give a single AoA mode that can be set when initializing the library. For details see the RTL API
Reference.
4.3 Location Finding (Positioning)
If there are multiple fixed-position locators that can calculate the direction of the transmitter (asset tag), the position of the asset tag can
be calculated from the angles using triangulation. Beside Angle of Arrival estimation the RTL library also provides location finding func-
tionality. Once the library learns the position of and gathers the angles from each locator it can provide a position estimation for asset
tags. Just as for AoA estimation, challenges introduced by the reflective and noisy environment are addressed.
4.3.1 Locator Configuration
In order to calculate the position of the asset tags (transmitters), the RTL library must learn both the position and the orientation of each
locator relative to a local coordinate system. The choice of the local coordinate system is arbitrary, the only constraint being that it must
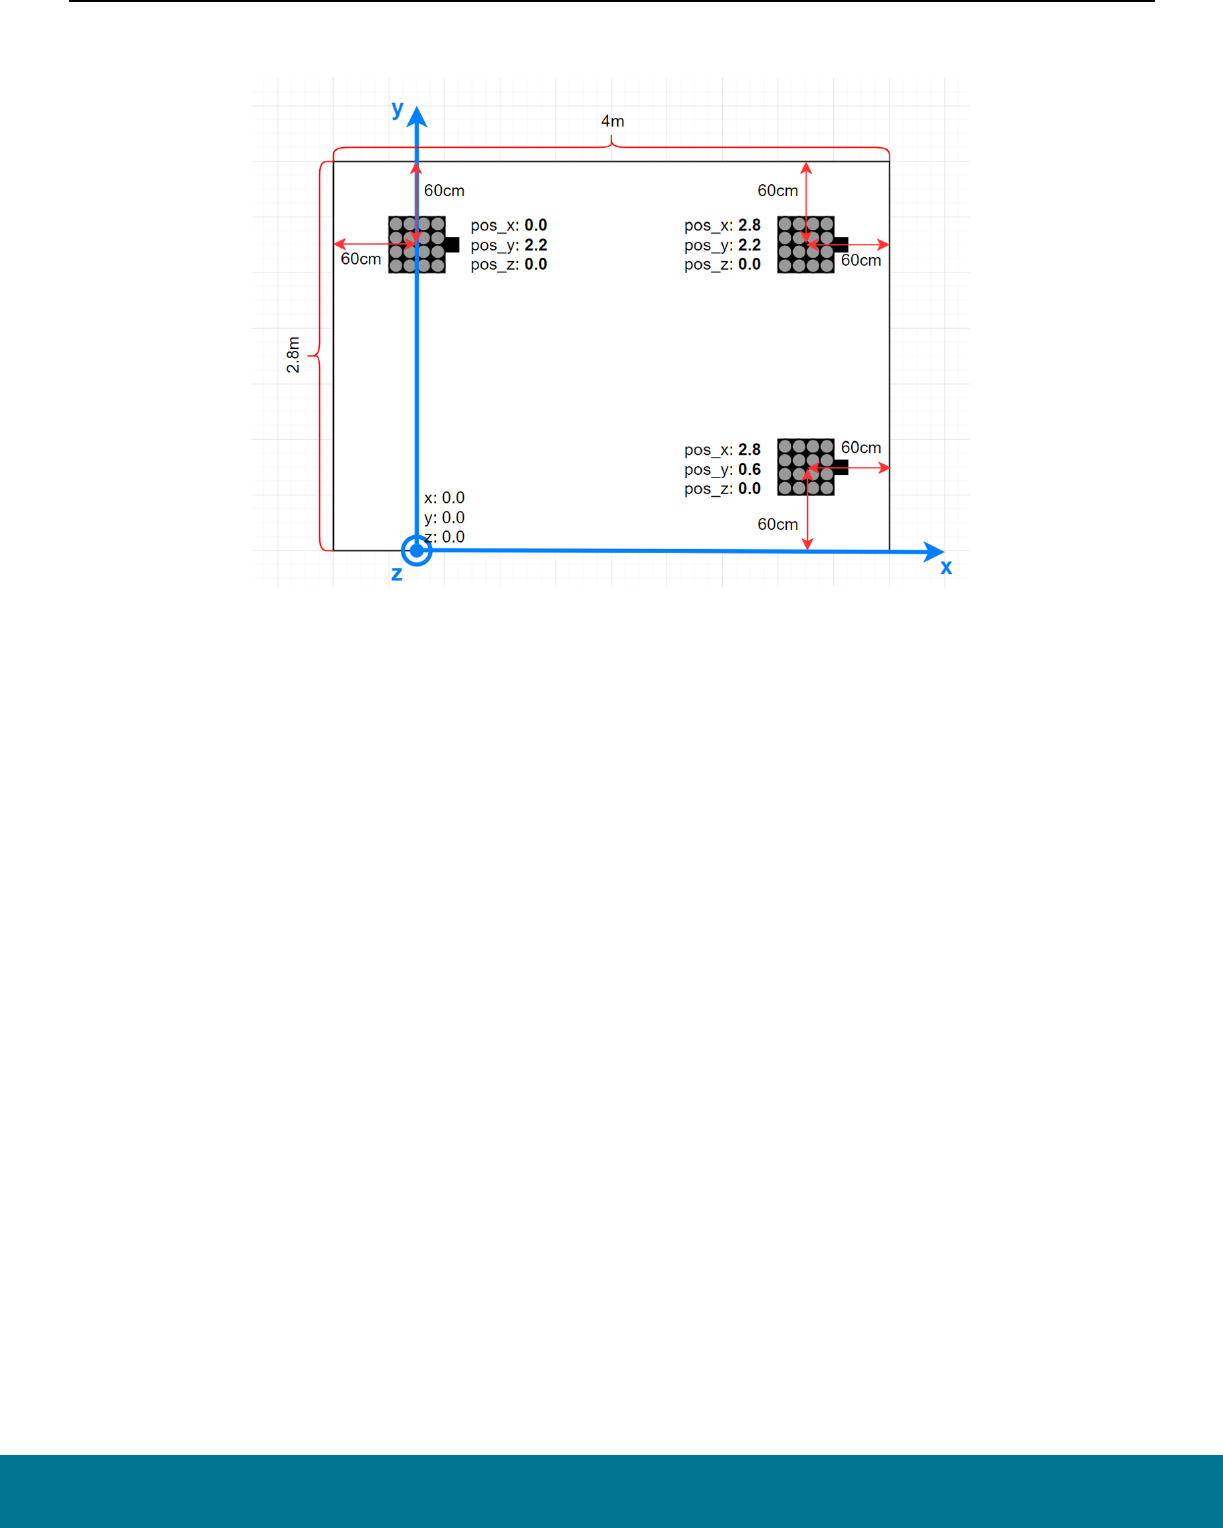
QSG175: Silicon Labs Direction-Finding Solution Quick-Start Guide
Real-Time Location (RTL) Library
silabs.com | Building a more connected world. Rev. 0.7 | 16
be right-handed Cartesian (so that if x is pointing right, y is pointing up, as on the following image), and the unit of distance must be meter.
The position of each locator board must be understood as the position of the center of the antenna array – relative to the origin.
The position and orientation of each locator can be provided to the RTL library using the RTL API, but the bt_host_positioning sample
app also makes it possible to describe the configuration of each locator in a single config file using JSON format. For more details see
AN1296: Application Development with Silicon Labs’ RTL Library and UG514: Using the Bluetooth® Direction Finding Tool Suite.
4.3.2 Location Finding Modes
The RTL library supports two location-finding modes: two-dimensional and three-dimensional. In three-dimensional mode x, y and z
coordinates of the tag are calculated from the azimuth and elevation angles. In two-dimensional mode, the z coordinate of the tag is fixed
(this fixed value must be provided to the library using the RTL API
sl_rtl_loc_set_target_parameter) and x and y coordi-
nates are calculated.
4.4 IQ Sample Quality Analysis
Errors from multiple sources can affect the quality of the received IQ samples. In a real-life environment, some phenomena are considered
as normal and not errors, but can also corrupt the perceived IQ data. The most notable example of this is the multipath propagation,
which twists the perceived magnitude and phase of the IQ sample data. Its extent depends on the particular antenna location in the array
as well as the position and the angle of the followed tag related to the locator antenna array.
The possible sources for the perceived noise may include the following:
• Radio receiver analog noise
• Quantization noise from the sampling
• Leaking signals from the surrounding channels folding into the band of interest
• Sampling jitter that translates into noise
• Other radio protocols operating on the same band
• Cosmic background noise
• And so on ….
In other words, there are a plenty of sources for signal noise even in relatively good conditions.
As well as the calculation of Angle of Arrival and position estimations, the RTL library also provides functionality called IQ sample quality
analysis to help the developer find the root cause of angle estimation issues by analyzing statistical properties of the IQ samples.
QSG175: Silicon Labs Direction-Finding Solution Quick-Start Guide
Real-Time Location (RTL) Library
silabs.com | Building a more connected world. Rev. 0.7 | 17
4.4.1 Description of Operation
The IQ sample quality analysis tool may be used to further investigate what could be the source of observed problems in the AoA/AoD
angle values. If the calculated angles seem to be good and the position values calculated from these are within the expected range,
investigating the quality analysis figures may not be of use.
The IQ sample quality analysis measures a few statistical key figures from the samples and presents them per antenna element level.
These include:
• Antenna’s signal level (in dB), average over snapshots in the same radio packet
• Antenna’s signal to noise ratio (SNR), noise measured as a level variation between antenna’s samples in the packet
• Phase value: antenna’s unrotated average phase value, in radians (relative to the delay between antenna elements in the array)
• Phase jitter: antenna’s unrotated phase variation, in radians
A few common, or not antenna related, values are included for a packet:
• The radio channel the packet was sent on
• Apparent supplemental tone frequency, in Hz
• Reference period signal to noise and distortion ratio (SNDR)
If enabled, the IQ sample quality analysis code detects some predefined conditions and raises a warning flag for each in case the limits
were exceeded. These limits are defined inside the RTL library and are subject to change without further notice. The limits are chosen
such that warning flags should not be raised in normal conditions but only occasionally. However, since every environment is different
the actual number of warnings may vary from system to system. These flags are shown to the user as bits in a bitmask output of the
overall status query function. Further information can be then queried using the detail query functions. The API allows querying details
for the latest packet received, or for the latest packet using a specified radio channel.
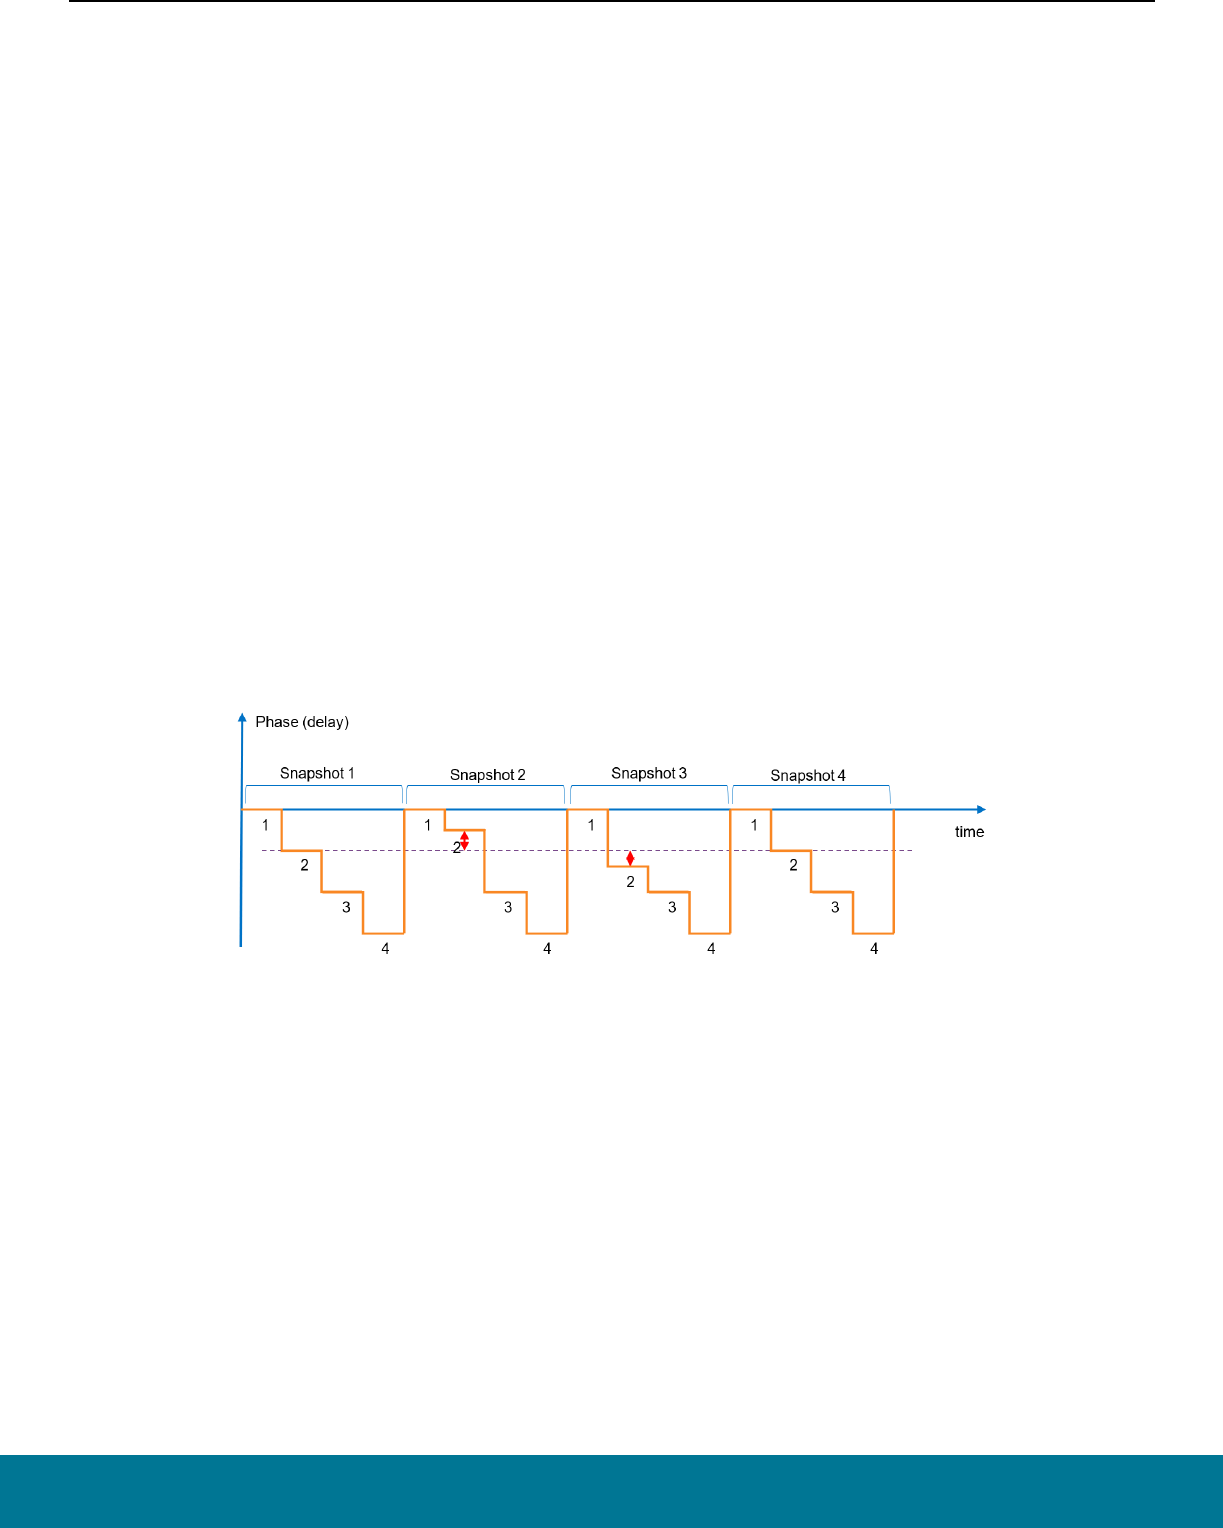
The following figure shows an example phase signal of a 1 x 4 antenna array. The signal is otherwise ideal, but some exaggerated error
is seen in the detected phase (=delay) values for the second antenna in the array during the snapshots 2 and 3. The amplitude graph
also resembles a step function, but unlike the phase signal, the amplitude value does not change the same way along the angle the signal
is arriving on. In real life the change from an antenna to next does not take place immediately but there is a transfer period during which
the signal settles. This is affected by the radio system and filtering.
4.4.2 Some Interpretation Examples
Here are some practical examples of what can be learned from the quality figures in different situations:
• The figures seem mostly good, but some channels have a high amount of noise.
These radio channels may be occupied by some other system.
• Some antennas show much lower amplitude levels. The amount of reduction, and also the antennas on which this is seen,
changes along the position of the followed tag.
Radio signal reflects from the surfaces of the surrounding space causing interference with the received signal (called multipath
propagation).
• Some antenna values show a lot of noise or the phase value is not changing relative to the tag movement as it does for other
antennas
The antenna board may be defective, preventing it from receiving the signal from one or more antennas.
• All the antennas’ phase values are the same
The tag is directly above the antenna board at a 90° elevation angle.
The antenna board may be defective and is not switching at all.

QSG175: Silicon Labs Direction-Finding Solution Quick-Start Guide
Real-Time Location (RTL) Library
silabs.com | Building a more connected world. Rev. 0.7 | 18
• Reference period SNDR value is bad
The whole packet may be corrupted because of some other system’s disturbance.
4.4.3 Usage
The IQ sample quality analysis tool is available through the Angle of Arrival/Departure API class of the RTL lib. See the functions starting
with sl_rtl_aox_iq_sample_qa_ in the API Reference. For a reference implementation of the usage of IQ sample quality analysis see the
aoa_locator host sample app in the Bluetooth SDK.

Silicon Laboratories Inc.
400 West Cesar Chavez
Austin, TX 78701
USA
www.silabs.com
IoT Portfolio
www.silabs.com/IoT
SW/HW
www.silabs.com/simplicity
Quality
www.silabs.com/quality
Support & Community
www.silabs.com/community
Simplicity Studio
One-click access to MCU and wireless
tools, documentation, software,
source code libraries & more. Available
for Windows, Mac and Linux!
Disclaimer
Silicon Labs intends to provide customers with the latest, accurate, and in-depth documentation of all peripherals and modules available for system and software imple-
menters using or intending to use the Silicon Labs products. Characterization data, available modules and peripherals, memory sizes and memory addresses refer to each
specic device, and “Typical” parameters provided can and do vary in dierent applications. Application examples described herein are for illustrative purposes only. Silicon
Labs reserves the right to make changes without further notice to the product information, specications, and descriptions herein, and does not give warranties as to the
accuracy or completeness of the included information. Without prior notication, Silicon Labs may update product rmware during the manufacturing process for security or
reliability reasons. Such changes will not alter the specications or the per formance of the product. Silicon Labs shall have no liability for the consequences of use of the infor-
mation supplied in this document. This document does not imply or expressly grant any license to design or fabricate any integrated circuits. The products are not designed or
authorized to be used within any FDA Class III devices, applications for which FDA premarket approval is required or Life Support Systems without the specic written consent
of Silicon Labs. A “Life Support System” is any product or system intended to support or sustain life and/or health, which, if it fails, can be reasonably expected to result in
signicant personal injury or death. Silicon Labs products are not designed or authorized for military applications. Silicon Labs products shall under no circumstances be used
in weapons of mass destruction including (but not limited to) nuclear, biological or chemical weapons, or missiles capable of delivering such weapons. Silicon Labs disclaims
all express and implied warranties and shall not be responsible or liable for any injuries or damages related to use of a Silicon Labs product in such unauthorized applications.
Note: This content may contain oensive terminolog y that is now obsolete. Silicon Labs is replacing the se terms with inclusive language wherever possible. For more
information, visit www.silabs.com/about-us/inclusive-lexicon-project
Trademark Information
Silicon Laboratories Inc.
®
, Silicon Laboratories
®
, Silicon Labs
®
, SiLabs
®
and the Silicon Labs logo
®
, Bluegiga
®
, Bluegiga Logo
®
, EFM
®
, EFM32
®
, EFR, Ember
®
, Energy Micro, Energy
Micro logo and combinations thereof, “the world’s most energy friendly microcontrollers”, Redpine Signals
®
, WiSeConnect , n-Link, ThreadArch
®
, EZLink
®
, EZRadio
®
, EZRadioPRO
®
,
Gecko
®
, Gecko OS, Gecko OS Studio, Precision32
®
, Simplicity Studio
®
, Telegesis, the Telegesis Logo
®
, USBXpress
®
, Zentri, the Zentri logo and Zentri DMS, Z-Wave
®
, and others
are trademarks or registered trademarks of Silicon Labs. ARM, CORTEX, Cortex-M3 and THUMB are trademarks or registered trademarks of ARM Holdings. Keil is a registered
trademark of ARM Limited. Wi-Fi is a registered trademark of the Wi-Fi Alliance. All other products or brand names mentioned herein are trademarks of their respective holders.
