
Inclusion in the Recording Studio?
Gender & Race/Ethnicity of Artists, Songwriters &
Producers across 1,200 Popular Songs
from 2012 to 2023
Dr. Stacy L. Smith, Dr. Katherine Pieper,
Karla Hernandez & Sam Wheeler
January 2024

INCLUSION IN THE RECORDING STUDIO?
EXAMINING , POPULAR SONGS FROM TO
USC ANNENBERG INCLUSION INITIATIVE
WOMEN ARE FINALLY GAINING GROUND IN MUSIC
22.7
21.9
20.9
25.1
28.1
16.8
Percentage of women out of all artists across 1,200 songs
RATIO OF MEN TO WOMEN
3:1
TOTAL NUMBER
OF ARTISTS
2,299
17.1
‘12 ‘13 ‘14 ‘15 ‘16 ‘17 ‘18
22.5
‘19
© 2024 DR. STACY L. SMITH
@Inclusionists
23.3
‘20 ‘21
20.2
‘22
30.2
35
‘23
WAS A YEAR WHEN WOMEN IN MUSIC SAW GROWTH
Areas where women’s participation increased across the music industry
SONGWRITERS
PRODUCERS
*
ARTISTS
GRAMMYS
®
Increased from
30.2% in 2022 to
35% in 2023
Increased from
14.1% in 2022 to
19.5% in 2023
Increased from
15.5% in 2023 to
24% in 2024
Increased from
3.5% in 2022 to
6.5% in 2023
*Despite reaching a 12-year high, the percentage of women producers was still below 10%, which
indicates that much more change is needed.

WOMEN SOLO ARTISTS ARE DRIVING CHANGE
Percentage of women solo artists by year...
34.8
40.6
30.6 22.5
38.4%
31.6%
36%
49.7%
48.4%
51.9%
55.6%
49%
OF ARTISTS WERE
PEOPLE OF COLOR
ACROSS , SONGS
FROM
Percentage of artists of color by year...
HISTORIC HIGHS FOR ARTISTS OF COLOR ON BILLBOARD HOT
Percentage of underrepresented men and women artists by year...
ARTISTS OF COLOR CONTINUE TO DOMINATE THE CHARTS
56.1%
© 2024 DR. STACY L. SMITH
(n=52) (n=46) (n=41) (n=31)
57.2%
59%
‘12 ‘13 ‘14 ‘15 ‘16 ‘17 ‘18 ‘19 ‘20 ‘21 ‘22
50.6%
Women
Men
‘12 ‘13 ‘14 ‘15 ‘16 ‘17 ‘19‘18
20
30
40
50
60
70
80
‘21‘20 ‘22
80
70
60
50
40
30
20
‘23
61%
‘23

© 2024 DR. STACY L. SMITH
30
to
1
THE RATIO OF MEN TO WOMEN PRODUCERS
ACROSS 9 POPULAR SONGS WAS
WOMEN ARE STILL OUTNUMBERED AS PRODUCERS
The prevalence of women producers was evaluated out of 900 songs reflecting the Billboard Hot 100 Year-End Charts from
2012, 2015 & 2017-2023.
1,97219
PRODUCING CREDITS WENT
TO WOMEN OF COLOR
OUT OF
WOMEN OF COLOR ARE INVISIBLE AS PRODUCERS
The prevalence of women producers was evaluated out of 900 songs reflecting the Billboard Hot 100 Year-End Charts from
2012, 2015 & 2017-2023.
WOMEN SONGWRITERS SEE GAINS FOR THE FIRST TIME SINCE
Songwriter gender by year...
2012 2014 2017
11% 12.7%
86.6%
13.4%
TOTAL
11.7%
2013 20162015 2018
11.7% 13.4%
2019
12.9%
2021
14.4%11.6%13.8%
89% 87.3% 88.3%88.3% 86.6% 88.4% 85.6% 85.7%
87.1%
2020 2022
14.1%
85.9%
2023
19.5%
80.5%86.2%
14.3%
WOMEN PRODUCERS ARE STILL IN THE SINGLE DIGITS
Percentage of men and women producers by year...
1.8%
98.2%
1.8%
98.2%
2%
98%
2.3%
97.7%
4.9%
95.1%
TOTAL
3.2%
96.8%
3.9%
96.1%
2.4%
97.6%
3.5%
96.5%
6.5%
93.5%

CREDITS & DEFICITS: MEN OUTPACE WOMEN IN SONGWRITING
THE TOP MALE
WRITER HAS
52
Leading men and women songwriters by number of credits...
CREDITS
THE TOP WOMAN
WRITER HAS
23
CREDITS
ACROSS ,
POPULAR
SONGS FROM
-
The top 10 male songwriters are responsible for 24.4% of the 1,200 most popular songs
from 2012 to 2023.
Top Men Songwriters
# of
credits
Top Women Songwriters
# of
credits
© 2024 DR. STACY L. SMITH
LINER NOTES LACK WOMEN SONGWRITERS
Women songwriters across 1,200 popular songs...
<1%
OF , POPULAR
SONGS HAVE
ONLY
WOMEN
WRITERS
44%
OF , POPULAR
SONGS HAVE
OR MORE
WOMEN
WRITERS
56%
OF , POPULAR
SONGS HAVE
NO
WOMEN
WRITERS
Aubrey Graham (Drake)
Martin Sandberg (Max Martin)
Lukasz Gottwald (Dr. Luke)
Benjamin Levin (Benny Blanco)
Henry Walter (Cirkut)
Justin Bieber
Savan Kotecha
Johan Schuster (Shellback)
Ashley Gorley
Dijon McFarlane (DJ Mustard)
Jacob Kasher Hindlin (JKash)
Louis Bell
52
47
33
27
27
25
24
22
22
19
19
19
Onika Maraj (Nicki Minaj)
Taylor Swift
Ariana Grande
Belcalis Almanzar (Cardi B)
Robyn Fenty (Rihanna)
Amala Dlamini (Doja Cat)
Megan Pete (Megan Thee Stallion)
Selena Gomez
Adele Adkins
Solána Imani Rowe (SZA)
Julia Cavazos (Julia Michaels)
Karla Estrabao (Camila Cabello)
Katheryn Hudson (Katy Perry)
23
21
17
16
15
13
11
10
10
10
9
9
9

0
25
50
75
100
14.7%
OF GRAMMY
®
NOMINEES
FROM 2013-2023
WERE WOMEN.
85.3% WERE MEN.
GENDER OF NOMINEES AT THE GRAMMYS
®
Percentage of women nominees by category, 2013-2024
89.2 70.787.8
Record of
the Year
Album of
the Year
Song of
the Year
Best New
Artist
53.8 98.4
Producer
of the Year
10.8 29.312.2 46.2 1.6
Women
Men
© 2024 DR. STACY L. SMITH
WOMEN CLIMB IN KEY CATEGORIES AT THE GRAMMYS
®
Compared to 2023, the percentage of women nominees in 2024...
0
10
20
30
40
50
60
15.1%
23.1%
12.5%
18.5%
38.1%
27%
55.6%
50%
15.5%
24%
Record of the Year Album of the Year Song of the Year Best New Artist Overall
Producer of the Year nominations are included in the overall total. There were no women nominated for Producer of the Year in 2023 or 2024.
3 women were nominated in the Songwriter of the Year category in 2023 and 1 woman was nominated in 2024.
2024
2023
Songwriter
of the Year
44.4
55.6

Annenberg Inclusion Initiative--1
Inclusion in the Recording Studio?
Gender & Race/Ethnicity of Artists, Songwriters, & Producers across 1,200 Popular Songs
from 2012 to 2023
Dr. Stacy L. Smith, Dr. Katherine Pieper, Karla Hernandez & Sam Wheeler
Annenberg Inclusion Initiative
The Annenberg Inclusion Initiative has evaluated inclusion on the Billboard Hot 100 Year-End charts for
the past six years. Our first report, released in 2018, included 6 years of data (2012-2017). Since then,
we have expanded the analysis each year, evaluating the gender (male, female, non-binary) and
underrepresented status (white, not white) for artists, songwriters, and producers who were credited on
the Hot 100 songs of the year. We compare the results for songs from 2023 to prior years to understand
if there has been change across positions for women and people of color. Additionally, we turn an eye to
nominees across 6 major categories at the Grammy® Awards: Record of the Year, Album of the Year,
Song of the Year, Best New Artist, Producer of the Year, and Songwriter of the Year. Below, the key
findings are detailed with major changes or problem areas bolded and italicized.
Key Findings
Artists
Gender. In 2023, 164 artists appeared on the Hot 100 Billboard Year-End Chart. Of these, 64.6% were
men, 34.8% were women, and 0.6% were gender non-binary.
In comparison to 2022 (30.2%), the percentage of women artists has increased in 2023 (35%), though
this is just shy (0.2 percentage points) of significance. In fact, 2023 was the highest number and
percentage of women artists across the 12-year time frame and represents a significant increase from
2017 forward.
Across the 12-year sample, women artists were the most likely to work in Pop (34.7%) and least likely in
Alternative (14.4%) and Hip-Hop (14.9%).
40.6% of individual artists (solo or “featuring”) in 2023 were women. This is a significant increase from
2022 (34.8%). However, the change from 2012 (35.8%) was just shy of significance (0.2).
Across 12 years, Drake had the most credits as a solo artist, appearing 52 times, double that of Justin
Bieber (25 songs). Nicki Minaj was the woman with the highest number of credits, appearing 25 times,
while Ariana Grande followed closely with 23 songs and Rihanna with 22 songs.
Of the 12 years sampled, Florida Georgia Line (10) and The Chainsmokers (6) held top spot for duos
while Maroon 5 (15), Imagine Dragons (9), and Migos (9) were the most-often credited bands.
Overall, women saw notable gains as artists on the Billboard Hot 100 chart in 2023. In fact, the year
was an historic high for women artists, both overall and most particularly as individual artists.
Underrepresented (Race/Ethnicity). Across the 164 artists in 2023, 61% were from an underrepresented
racial/ethnic group. 2023 was significantly higher than 2022 (50.6%) and 2012 (38.4%). 2023 marks a

Annenberg Inclusion Initiative--2
new high for underrepresented artists across all years analyzed, surpassing the previous record of 59%
in 2020.
In 2023, for men, 59.4% of the artists were underrepresented and 40.6% were white. This represents an
uptick for underrepresented men from 2022 (45%) and 2012 (39.9%).
For women, however, the numbers remained unchanged. The percentage of underrepresented women
in 2023 (65%) was the same as 2022 (65%) and has almost doubled since 2012 (33.3%). Put differently,
women of color continue to dominate the charts.
Underrepresented artists were most likely to rule the Hip-Hop/Rap (88.2%) and R&B/Soul (90.5%)
genres from 2012-2023. White artists accounted for 61.6% of all Pop credits over the last 12 years.
Country and Alternative genres were almost exclusively the domain of White performers as less than
10% of artists in either genre were underrepresented.
57.4% of all individual artists were from an underrepresented racial background in 2023. This
percentage is not significantly different from 2022 (54.1%) or 2012 (54.1%). The percentage of
underrepresented band members increased by 54.1 percentage points from 2022 (21.7%) to 2023
(75.8%). This increase was primarily due to 3 bands performing regional Mexican music whose songs
appeared on the charts last year.
Drake was the top performer from an underrepresented racial/ethnic group across the 12-year sample
(52 credits). This is double that of Nicki Minaj (25) and Rihanna (22), who took the next two spots on the
list. For white performers, Justin Bieber (25) topped the list, followed by Ariana Grande (23) and Taylor
Swift (20).
Songwriters
Across 12 years, 5,673 songwriters were credited on a song appearing on the Billboard Hot 100 Year-End
Charts.
This included 441 songwriters credited in 2023. Of those 441 credits, 80.3% were men and 19.5%
were women. There was one gender non-binary songwriter in 2023 (0.2%).
2023 was the first year in which there was a significant increase for women songwriters. In 2023, the
percentage of women songwriters was 5.4 percentage points higher than 2022 (14.1%) and 8.5
percentage points above 2012 (11%). This is a 12-year high and the first time the percentage has risen
above 15%.
Turning to race/ethnicity of women songwriters, 55 women of color worked as songwriters in 2023.
This represents a significant increase in the number of women of color songwriters from 2022 (33) to
2023 (55), and a 12-year high.
The number of women of color songwriters in 2023 was more than 3 times the number of women of
color on the charts in 2012 (14). In contrast, the number of white women songwriters on the charts in
2023 (31) was not meaningfully different than 2022 (30) or 2012 (33). This suggests that the gains for
women songwriters overall are due to the inclusion of women of color on the charts.

Annenberg Inclusion Initiative--3
Looking to genre, across 12 years, women were most likely to write Pop (20.1%) and Dance/Electronic
(19.6%) songs, and least likely to write Hip-Hop/Rap (7.5%) and Country (9.9%) songs. Even in the genre
where they worked the most (Pop), women songwriters were outnumbered by a ratio of 4 to 1.
For songwriters working the most across the sample, there was a significant difference between men
and women. The men who are credited most on the charts have more songs across 12 years than all but
2 of the most-credited women. In fact, 7 of the 12 men with the highest number of songwriting credits
had more total songs on the charts than the highest credited woman. Moreover, the top 12 males with
songwriting credits penned 24.4% of the songs in the entire 12-year sample.
The number of songs with or without out any women songwriters was also of interest. In 2023, 56% of
songs included at least one woman songwriter. This was a 12-year high and a significant increase from
2022 (42%) and 2012 (42%).
Across the 12-year sample, 44% of all songs had one or more women writers credited and 56%
completely excluded women. In comparison, less than 1% (0.6%) or 7 songs did not credit a man in a
songwriting role.
Producers
Producers across the following years were analyzed: 2012, 2015, and 2017-2023.
There were 217
producers credited on the 2023 Hot 100 Year-End Charts. Of those, 6.5% were women and 93.5% were
men. In 2023, there was one producer who identified as gender non-binary.
2023 (6.5%) marks a new high for women as producers, surpassing the previous high reached (4.9%) in
2019. However, 2023 was not a significant increase from 2022 (3.5%), nor was it an increase from 2012
(2.4%). Across 9 years and a total of 1,972 producing credits, men comprised 96.8% of all producers
while women comprised 3.2%. This is a gender ratio of 29.8 men to every 1 woman producer.
Of the 64 women producers across the sample, 19 or 29.7% were women of color. In 2023, 6 women of
color worked as producers. Three of these women worked as producers on their own songs. The ratio of
men producers to underrepresented women producers is 100.4 to 1. Across all years sampled, 94% of
the 831 songs evaluated did not include a single woman producer. In total, only 6% of all songs, or 50
songs, included a women producer.
The 64 credits for women producers were held by 34 unique women working one or more times. Under
two-thirds (61.8%, n=21) of the women producers worked only once on a Hot 100 Year-End song across
9 years. Thirteen women were credited as producers more than once across all years examined. Taylor
Swift and Ariana Grande produced the most songs (8) in the sample. Twelve of the 34 individual women
producers were women of color. Beyonce and Mariah Carey both had 4 producing credits, the most for
women of color across the sample. Eight of these women produced songs for which they were not also a
performer.
Grammy® Awards: 2013 to 2024
Annually, we conduct an analysis regarding nominees across 6 major Grammy® Award categories:
Record of the Year, Album of the Year, Song of the Year, Best New Artist, Producer of the Year,
Songwriter of the Year.

Annenberg Inclusion Initiative--4
In 2024, there were a total of 171 nominees; 76% were men and 24% were women. This is a ratio of 3.2
men nominated to every 1 woman. Two gender non-binary individuals were nominated in 2024, and 4
total gender non-binary individuals have been nominated since 2013.
2024 saw a significant increase in the percentage of women nominees, from 15.5% in 2023 to 24% in
2024. This was also significantly higher than 2013 (7.9%), but remains below the highest percentage of
women nominees, which was reached in 2021 (28.1%).
Across 12 years of nominations, 2024 was a significant increase for women across four of the six
categories: Record of the Year, Album of the Year, Song of the Year and Best New Artist.
When looking at the intersectionality of gender and race/ethnicity across 12 years, 52.6% of women
nominees were white and 47.4% were from an underrepresented racial/ethnic group. Compared to
2023 (61.7%) and 2022 (58.8%), there was a decrease in nominations for women of color in 2024
(36.6%). 2024 was on par with 2013 (33.3%) in terms of the percentage of nominations for women of
color.
The report concludes with solutions for change, particularly in the area of songwriting. It is clear that
inroads are being made for women in music, which the authors of this report applaud. Groups such as
She Is The Music, Spotify Equal, Women’s Audio Mission, Keychange, and Moving the Needle, have been
working aggressively towards this end. The report identifies three opportunities: considering each song
as an opportunity to add women, continuing to support existing programs, and eliminating barriers for
women in music.

Annenberg Inclusion Initiative--5
Inclusion in the Recording Studio?
Gender & Race/Ethnicity of Artists, Songwriters, & Producers across 1,200 Popular Songs
from 2012 to 2023
The Annenberg Inclusion Initiative has evaluated inclusion on the Billboard Hot 100 Year-End charts for
the past six years. Our first report, released in 2018, included six years of data (2012-2017). Since then,
we have expanded the analysis each year, evaluating the gender (male, female, non-binary) and
underrepresented status (white, not white) for artists, songwriters, and producers who were credited on
the Hot 100 songs of the year.
1
We compare the results for songs from 2023 to prior years to
understand if there has been change across positions for women and people of color. Additionally, we
turn an eye to nominees across 6 major categories at the Grammy® Awards: Record of the Year, Album
of the Year, Song of the Year, Best New Artist, Producer of the Year, and Songwriter of the Year.
2
There are four primary sections in this report. The first section focuses on artist gender and
race/ethnicity, along with the type of performers on the charts (solo, duo, group) and song genre. Then,
we turn to songwriter and producer analyses that provide insight into trends for women and women of
color. Third, we examine the Grammy® nominees over time. Finally, the report concludes by
summarizing the trends across analyses and offers solutions to create or sustain change.
Consistent with all our reports, differences of 5 percentage points or greater are required to provide
evidence of change over time. This avoids calling out trivial changes of 1-2 percentage points. For each
analysis, we compare data in 2023 to that from 2022 and then 2012. This illuminates both short- and
long-term trends in the data.
Artists
Gender. In 2023, 164 artists appeared on the Hot 100 Billboard Year-End Chart. Of these, 64.6% (n=106)
were men, 34.8% (n=57) were women, and 0.6% (n=1) were gender non-binary. This means that there
are 1.9 artists who were men on the charts for every one woman.
In comparison to 2022 (30.2%), the percentage of women artists has increased in 2023 (35%), though
this is just shy (0.2 percentage points) of significance. In fact, 2023 is the highest number and percentage
of women artists across the 12-year time frame and represents a significant increase from 2017 forward.
Despite these gains, there is still significant ground to cover before women on the charts reflect the
percentage of women in the U.S. population (50.4%).
3
2023 was also the third year in which a non-binary artist was credited on the charts. There have been a
total of four credits for non-binary artists in 12 years. However, the same artist (Sam Smith) was
credited in each year: 2019 (2), 2022 (1) and 2023 (1).

Annenberg Inclusion Initiative--6
Table 1
Artist Gender by Year
Year
Men
Women
Ratio
2012
77.3% (n=153)
22.7% (n=45)
3.4 to 1
2013
78.1% (n=168)
21.9% (n=47)
3.6 to 1
2014
79.1% (n=178)
20.9% (n=47)
3.8 to 1
2015
74.9% (n=146)
25.1% (n=49)
3 to 1
2016
71.9% (n=138)
28.1% (n=54)
2.6 to 1
2017
83.2% (n=178)
16.8% (n=36)
4.9 to 1
2018
82.9% (n=179)
17.1% (n=37)
4.8 to 1
2019
77.5% (n=131)
22.5% (n=38)
3.4 to 1
2020
79.8% (n=138)
20.2% (n=35)
3.9 to 1
2021
76.7% (n=138)
23.3% (n=42)
3.3 to 1
2022
69.8% (n=111)
30.2% (n=48)
2.3 to 1
2023
65% (n=106)
35% (n=57)
1.8 to 1
Total
76.7% (n=1,764)
23.3% (n=535)
3.3 to 1
Note: A total of 4 credits went to gender nonbinary artists. Looking at the data, all of these entries were
accounted for by one performer: Sam Smith. As such, these credits were excluded from the analyses in
the table and are not presented.
The relationship between artist gender and song genre is displayed in Table 2.
4
A few trends are readily
apparent. First, women were most likely to work in Pop (34.7%) and least likely in Alternative (14.4%).
Matter of fact, the gender ratio for Alternative artists was 5.9 men to every 1 woman. Hip-Hop was also
a space with few women. Only 14.9% of all Hip-Hop artists were women with a ratio of 5.7 men to every
1 woman artist in this space.
Table 2
Song Genre by Artist Gender
Genre
Men
Women
Gender Ratio
Pop
65.3%
(n=570)
34.7%
(n=303)
1.9 to 1
Hip-Hop
85.1%
(n=554)
14.9%
(n=97)
5.7 to 1
Alternative
85.6%
(n=208)
14.4%
(n=35)
5.9 to 1
Country
82.9%
(n=203)
17.1%
(n=42)
4.8 to 1
R&B/Soul
77%
(n=97)
23%
(n=29)
3.3 to 1
Dance/Electronic
78.5%
(n=106)
21.5%
(n=29)
3.6 to 1
Note: Songs were collapsed into a total of 6 genres using iTunes designations. Each artist was
analyzed for gender, race/ethnicity and song genre. 5 songs could not be categorized into these
designations and do not appear in the table.

Annenberg Inclusion Initiative--7
Following genre, we examined how artist gender was related to performer type.
5
Three categories of
performers were assessed: individuals, duos, and bands. Within each of these artist categories, we
evaluated the percentage of men and women. Table 3 shows that 40.6% of individual artists (solo or
“featuring”) in 2023 were women. This is a significant increase from 2022 (34.8%) though not from 2012
(35.8%). There were no women that appeared in duos in 2023, and only a handful of band members
(15.2%) were women in 2023. The small sample sizes for women in these latter categories do not allow
for over time comparisons.
Table 3
Percentage of Women Artists by Performer Type
Year
Individual Artist
Duo
Band
2012
35.8% (n=39)
16.7% (n=1)
6% (n=5)
2013
33.3% (n=37)
10% (n=2)
9.5% (n=8)
2014
35.8% (n=43)
0
4.6% (n=4)
2015
30.8% (n=41)
10% (n=1)
13.5% (n=7)
2016
35.2% (n=43)
0
22.9% (n=11)
2017
25.6% (n=34)
4.5% (n=1)
1.7% (n=1)
2018
26.2% (n=37)
0
0
2019
27.3% (n=35)
16.7% (n=2)
3.4% (n=1)
2020
22.5% (n=31)
33.3% (n=2)
6.9% (n=2)
2021
30.6% (n=41)
0
2.6% (n=1)
2022
34.8% (n=46)
25% (n=1)
4.3% (n=1)
2023
40.6% (n=52)
0
15.2% (n=5)
Total
31.3% (n=479)
7.1% (n=10)
7.3% (n=46)
Note: Groups with 3 or more artists were considered a band if they were under a single moniker, save 1. The
percentage of male individual performers, members of duos, or bands can be found by subtracting a specific
cell from 100%. Featuring credits were included in all analyses. Columns nor rows add to 100%. Gender non-
binary artists were not included in these analyses and data are not presented in the table.
We do a yearly analysis to determine whether gender plays a role in the frequency of employment
between solo artists across the Hot 100 Year End charts. For this analysis we are interested in
understanding the number of times each solo performer appears on a song. Before conducting the
analysis, songs that repeated over the course of the study were removed. 122 songs appeared in more
than one year and were removed to avoid double counting. When removed, the total number of songs
from the 12 years sampled reduces from 1,200 to 1,078 unique songs. Credits were then summed for
solo artists. The results can be found in Table 4.

Annenberg Inclusion Initiative--8
Table 4
Number of Song Credits by Solo Artists’ Gender
# of Songs
Men Artists
Women Artists
Total
# of
Artists
%
# of
Artists
%
# of
Artists
%
1
199
58%
73
54.9%
272
57.1%
2
45
13.1%
18
13.5%
63
13.2%
3
30
8.7%
12
9%
42
8.8%
4
12
3.5%
5
3.8%
17
3.6%
5
14
4.1%
6
4.5%
20
4.2%
≥6
43
12.5%
19
14.3%
62
13%
Total
343
100%
133
100%
476
100%
Note: Range was grouped for presentational purposes with 6 or greater credits in one category.
Similar to other years, the credits for individual artists were determined using both artists’ names
and/or pseudonyms. Nonbinary was not included in the table due to low sample size. Only one
performer identifies as non-binary and they have a total of 4 credits across the 12-year sample.
Across 12 years, Drake had the most credits as a solo artist, appearing 52 times, double that of Justin
Bieber (25 songs). Nicki Minaj was the woman with the highest number of credits, appearing 25 times,
while Ariana Grande followed closely with 23 songs. Table 5 reflects the top men and women artists.
Not featured in Table 5 are the top duos and bands. Of the 12 years sampled, Florida Georgia Line (10)
and The Chainsmokers (6) held the top spot for duos while Maroon 5 (15), Imagine Dragons (9), and
Migos (9) were the most-often credited bands.
Table 5
Top Performing Individual Artists by Number of Song Credits
Rank
Men
Rank
Women
Name
# of
Songs
Name
# of
Songs
1
Drake
52
1
Nicki Minaj
25
2
Justin Bieber
25
2
Ariana Grande
23
3
The Weeknd
18
3
Rihanna
22
4
Chris Brown
17
4
Taylor Swift
20
5
Morgan Wallen
15
5
Cardi B
16
5
Future
15
6
Doja Cat
13
6
Ed Sheeran
14
7
Selena Gomez
12
6
Post Malone
14
6
Bad Bunny
14
6
Luke Combs
14
7
Lil Baby
13

Annenberg Inclusion Initiative--9
Overall, women saw notable gains as artists on the Billboard Hot 100 chart in 2023. In fact, the year was
an historic high for women artists, both overall and most particularly as individual artists. There are still
places that remain relatively closed to women, however. Those are genres such as alternative, hip-hop,
and country music. Additionally, duos and bands are still places where women’s participation is minimal.
While individual women are responsible for the sea change we observed, there is room for this rising
tide to lift boats in other areas.
Underrepresented Artists. Across the 164 artists in 2023, 61% (n=100) were from an underrepresented
racial/ethnic group.
6
2023 was significantly higher than 2022 (50.6%) and 2012 (38.4%). 2023 marks a
new high for underrepresented artists across all years analyzed, surpassing the previous record of 59%
in 2020. Since 2015, the charts have been notably higher than U.S. Census, where 41.1% of the
population identifies with an underrepresented racial/ethnic group.
7
Table 6
Artist Underrepresented Status by Year
Year
White
UR
Ratio
2012
61.6% (n=122)
38.4% (n=76)
1.6 to 1
2013
68.4% (n=147)
31.6% (n=68)
2.2 to 1
2014
64% (n=144)
36% (n=81)
1.8 to 1
2015
50.3% (n=98)
49.7% (n=97)
1 to 1
2016
51.6% (n=99)
48.4% (n=93)
1.1 to 1
2017
48.1% (n=103)
51.9% (n=111)
.93 to 1
2018
44.4% (n=96)
55.6% (n=120)
.8 to 1
2019
43.9% (n=75)
56.1% (n=96)
.8 to 1
2020
41% (n=71)
59% (n=102)
.7 to 1
2021
42.8% (n=77)
57.2% (n=103)
.7 to 1
2022
49.4% (n=79)
50.6% (n=81)
1 to 1
2023
39% (n=64)
61% (n=100)
.6 to 1
Total
51% (n=1,175)
49% (n=1,128)
1 to 1
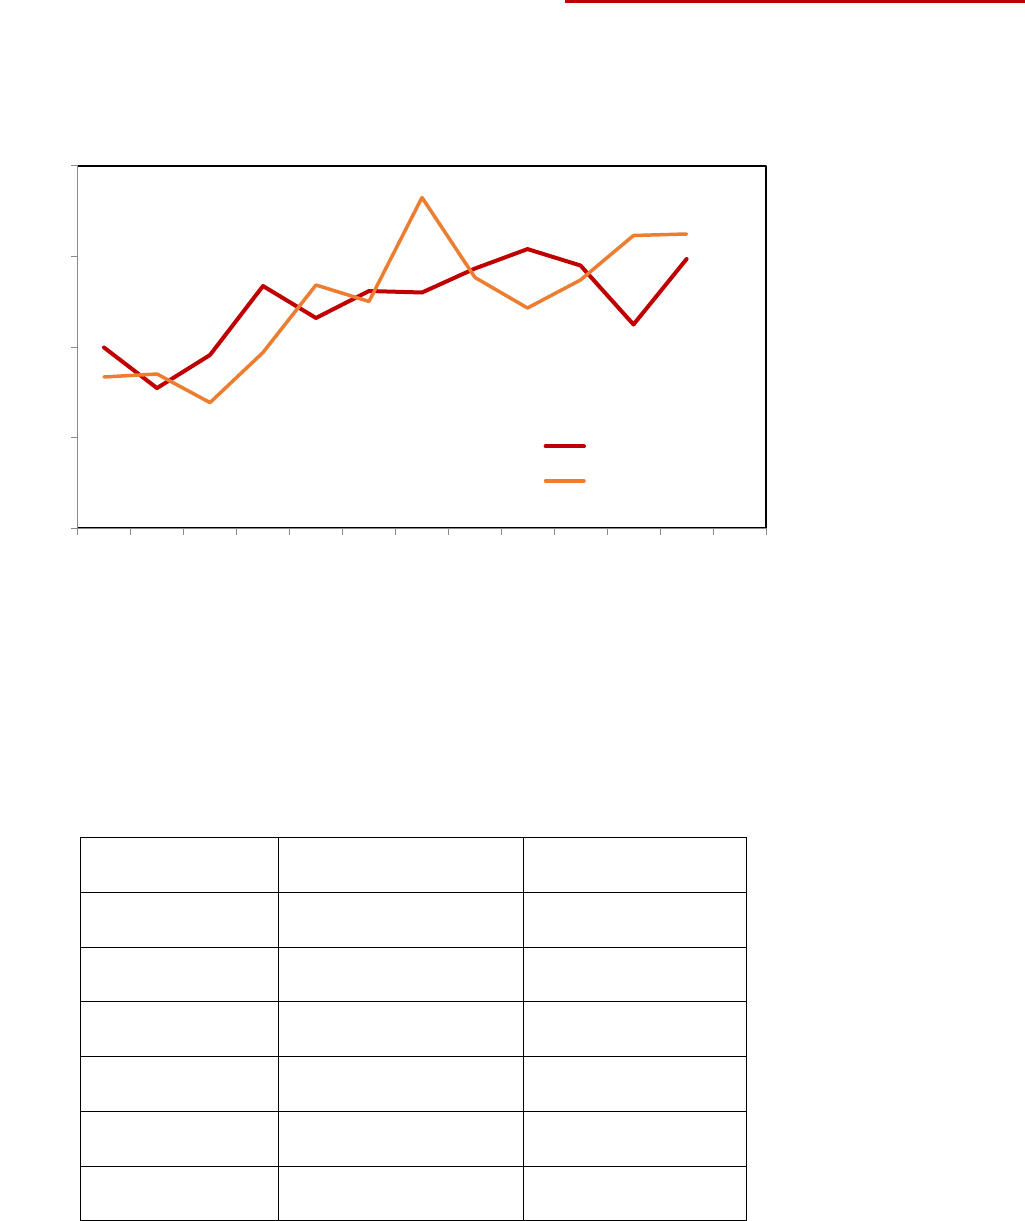
We also assessed how underrepresented status related to gender, genre and performer type. In terms
of gender, men and women were examined separately. In 2023, for men, 59.4% of the artists were
underrepresented and 40.6% were white. This represents an uptick for underrepresented men from
2022 (45%) and 2012 (39.9%).
For women, however, the numbers remained unchanged. The percentage of underrepresented women
in 2023 (65%) was the same as 2022 (65%) and has almost doubled since 2012 (33.3%). Put differently,
women of color continue to dominate the charts.
Annenberg Inclusion Initiative--10
Figure 1
Underrepresented Men & Women Artists Over time
Underrepresented status was also related to genre. As shown in Table 7, underrepresented artists were
most likely to dominate the Hip-Hop/Rap (88.2%) and R&B/Soul (90.5%) genres. White artists accounted
61.6% of all Pop credits over the last 12 years. Further, the Country and Alternative genres were almost
exclusively the domain of White performers as less than 10% of artists in either genre were
underrepresented.
Table 7
Song Genre by Underrepresented Status of Artists
Genre
Underrepresented
Artists
White
Artists
Pop
38.4%
(n=337)
61.6%
(n=540)
Hip-Hop/Rap
88.2%
(n=574)
11.8%
(n=77)
Alternative
8.6%
(n=21)
91.4%
(n=222)
Country
6.1%
(n=15)
93.9%
(n=230)
R&B/Soul
90.5%
(n=114)
9.5%
(n=12)
Dance/Electronic
30.4%
(n=41)
69.6%
(n=94)
Note: Songs were collapsed into 6 genres using iTunes designations. Each artist
was analyzed for race/ethnicity and genre. 5 songs could not be categorized into
these distinctions and were not included in the chart.
40%
31%
38%
53%
46%
52%
52%
57%
62%
58%
45%
59%
33%
34%
28%
39%
54%
50%
73%
55%
49%
55%
65% 65%
0%
20%
40%
60%
80%
2012 2013 2014 2015 2016 2017 2018 2019 2020 2021 2022 2023
UR Males
UR Females

Annenberg Inclusion Initiative--11
Three categories of performers were analyzed by race/ethnicity: individual artists, duos, and bands. As
shown in Table 8, 57.4% of all individual artists were from an underrepresented racial background in
2023. This percentage is not significantly different from 2022 (54.1%) or 2012 (54.1%). There was only 1
duo on the charts in 2023; thus 50% of the artists in duos in 2023 were underrepresented. The
percentage of underrepresented band members increased by 54.1 percentage points from 2022 (21.7%)
to 2023 (75.8%). This increase was primarily due to 3 bands performing regional Mexican music whose
songs appeared on the charts last year.
Table 8
Percentage of Underrepresented Artists by Performer Type
Year
Individual
Duo
Band
2012
54.1% (n=59)
66.7% (n=4)
15.7% (n=13)
2013
52.3% (n=58)
15% (n=3)
8.3% (n=7)
2014
54.2% (n=65)
38.9% (n=7)
10.3% (n=9)
2015
56.4% (n=75)
70% (n=7)
28.8% (n=15)
2016
60.7% (n=74)
18.2% (n=4)
31.2% (n=15)
2017
65.4% (n=87)
27.3% (n=6)
30.5% (n=18)
2018
70.2% (n=99)
20% (n=2)
29.2% (n=19)
2019
65.4% (n=85)
33.3% (n=4)
24.1% (n=7)
2020
65.2% (n=90)
0
41.4% (n=12)
2021
64.2% (n=86)
25% (n=2)
39.5% (n=15)
2022
54.1% (n=72)
100% (n=4)
21.7% (n=5)
2023
57.4% (n=74)
50% (n=1)
75.8% (n=25)
Total
60.3% (n=924)
31.4% (n=44)
25.4% (n=160)
Note: Groups with 3 or more artists were considered a band provided that they were under a single
moniker, save 1 (Panic! At the Disco). The percentage of white individual performers and members of
duos or bands can be found by subtracting a specific cell from 100%. Featuring credits were included in
all analyses. Columns nor rows add to 100%.
The number of times that an underrepresented artist worked across 12 years was also assessed.
Duplicate songs were removed from analysis before computing credit frequency. White artists (63.2%)
were more likely than underrepresented artists (52.4%) to have only one credit on the Billboard Hot 100
Year-End Charts across the years evaluated.

Annenberg Inclusion Initiative--12
Table 9
Number of Songs by Underrepresented Status of Artists with Solo Credits
# of Songs
UR Artists
White Artists
Total
# of
Artists
%
# of
Artists
%
# of
Artists
%
1
140
52.4%
132
63.2%
272
57.1%
2
37
13.9%
26
12.4%
63
13.2%
3
28
10.5%
14
6.7%
42
8.8%
4
12
4.5%
5
2.4%
17
3.6%
5
11
4.1%
9
4.3%
20
4.2%
>6
39
14.6%
23
11%
62
13%
Total
267
100%
209
100%
476
100%
Note: Range was grouped for presentational purposes with 6 or more credits amassed in one
category. Individual artist credits were determined using both their name and any pseudonyms.
Drake was the top performer across the 12-year sample (52 credits). This was double that of Nicki Minaj
(25) and Rihanna (22), who took the next two spots on the list. For white performers, Justin Bieber (25)
topped the list, followed by Ariana Grande (23) and Taylor Swift (20). See Table 10.
Table 10
Top Performing Solo Artists by Underrepresented Status
Rank
UR Artists
# of
Songs
Rank
White Artists
# of
Songs
1
Drake
52
1
Justin Bieber
25
2
Nicki Minaj
25
2
Ariana Grande
23
3
Rihanna
22
3
Taylor Swift
20
4
The Weeknd
18
4
Morgan Wallen
15
5
Chris Brown
17
5
Ed Sheeran
14
6
Cardi B
16
5
Post Malone
14
7
Future
15
5
Luke Combs
14
8
Bad Bunny
14
6
Calvin Harris
11
9
Lil Baby
13
7
Adele
10
9
Doja Cat
13
7
Luke Bryan
10
10
Selena Gomez
12
7
Dua Lipa
10
11
Kendrick Lamar
11
8
Katy Perry
9
11
Bruno Mars
11
11
Kane Brown
11
In 2023, underrepresented artists were once again the majority of performers with songs on the Hot 100
Year-End chart. Underrepresented men outnumbered their white counterparts, but it was
underrepresented women who far surpassed white women in terms of chart-topping prowess. Despite
the continued success of underrepresented artists, clearly this was due to the success of certain genres
where underrepresented artists thrive (e.g., Hip-Hop/Rap, R&B/Soul) and not because

Annenberg Inclusion Initiative--13
underrepresented artists were able to participate across all genres. Next, we turn to the individuals
working behind the scenes to understand how often these roles are populated with women and women
of color in particular.
Songwriting and Producing
Songwriters and producers from the 2023 iteration of the Billboard Hot 100 Year-End Charts were
analyzed, building on data collected from 2012-2022.
8
The analyses in this section focus on gender and
then race/ethnicity for women only.
Songwriters. Across 12 years, 5,673 songwriters were credited on a song appearing on the Billboard Hot
100 Year-End Charts.
As shown in Table 11,
this included 441 songwriters credited in 2023. Of those,
80.3% (n=355) were men and 19.5% (n=86) were women. There was one gender non-binary songwriter
in 2023 (0.2%).
2023 was the first year in which there was a significant increase for women songwriters. In 2023, the
percentage of women songwriters was 5.4 percentage points higher than 2022 (14.1%) and 8.5
percentage points above 2012 (11%). This is a 12-year high and the first time the percentage has risen
above 15%. Overall, the gender ratio of men to women songwriters across 12 years was 6.4 men to
every 1 woman.
Table 11
Songwriter Gender by Year
Gender
Men
Women
Ratio
2012
89% (n=380)
11% (n=47)
8.1 to 1
2013
88.3% (n=355)
11.7% (n=47)
7.6 to 1
2014
87.3% (n=404)
12.7% (n=59)
6.8 to 1
2015
86.2% (n=413)
13.8% (n=66)
6.2 to 1
2016
86.6% (n=420)
13.4% (n=65)
6.5 to 1
2017
88.4% (n=442)
11.6% (n=58)
7.6 to 1
2018
88.3% (n=523)
11.7% (n=69)
7.6 to 1
2019
85.6% (n=439)
14.4% (n=74)
5.9 to 1
2020
87.1% (n=391)
12.9% (n=58)
6.7 to 1
2021
85.7% (n=406)
14.3% (n=68)
6 to 1
2022
85.9% (n=385)
14.1% (n=63)
6.1 to 1
2023
80.5% (n=355)
19.5% (n=86)
4.1 to 1
Total
86.6% (n=4,913)
13.4% (n=760)
6.5 to 1
Note: A total of 19 songwriters from 2012 to 2023 were gender non-binary, representing 0.3% of all
songwriters. These credits reflect the work of 3 individual songwriters. As such, the percentage of
gender non-binary songwriters was not included in the analysis presented in the table.
Turning to race/ethnicity of women songwriters, 55 women of color worked as songwriters in 2023. This
represents a significant increase in the number of women of color songwriters from 2022 (33) to 2023
(55), and a 12-year high. In fact, the number of women of color songwriters in 2023 was more than 3
times the number of women of color on the charts in 2012 (14). In contrast, the number of white

Annenberg Inclusion Initiative--14
women songwriters on the charts in 2023 (31) was not meaningfully different than 2022 (30) or 2012
(33). This suggests that the gains for women songwriters overall are due to the inclusion of women of
color on the charts. See Figure 2.
Figure 2
Number of Women Songwriters by Underrepresented Status Per Year
Looking to genre, across 12 years, women were most likely to write Pop (20.1%) and Dance/Electronic
(19.6%) songs, and least likely to write Hip-Hop/Rap (7.5%) and Country (9.9%) songs. As shown in Table
12, even in the genre where they worked the most (Pop), women songwriters were outnumbered by a
ratio of 4 to 1.
33
29
38
39
34
27
28
30
32
30
30
31
14
18
21
27
31
31
41
44
26
38
33
55
0
10
20
30
40
50
60
2012 2013 2014 2015 2016 2017 2018 2019 2020 2021 2022 2023
White WOC

Annenberg Inclusion Initiative--15
Table 12
Song Genre by Songwriter Gender
Genre
Men Songwriters
Women Songwriters
Pop
79.9%
(n=1,639)
20.1%
(n=413)
Hip-Hop/Rap
92.5%
(n=1,803)
7.5%
(n=146)
Alternative
88.1%
(n=310)
11.9%
(n=42)
Country
90.1%
(n=511)
9.9%
(n=56)
R&B/Soul
88.5%
(n=456)
11.5%
(n=59)
Dance/Electronic
80.4%
(n=181)
19.6%
(n=44)
Note: Songs were collapsed into 6 genres using iTunes designations. Each songwriter
was analyzed for gender and genre. 5 songs could not be categorized into these
distinctions and were not included in the chart.
How frequently each individual songwriter worked across 12 years was also of interest. Songwriters
were identified by individual name (or pseudonym) and repeat appearances were eliminated to avoid
double counting. Across 12 years, 2,375 songwriters were analyzed. Of these, 86.6% (n=2,057) were
men and 13.4% (n=318) were women. This is a gender ratio of 6.5 men for every 1 woman songwriter. In
the 12 years studied, there have been 3 gender non-binary songwriters. As shown in Table 13, most
songwriters had only 1 credit across the 12-year sample whether they were men or women.
Table 13
Number of Songs by Songwriter Gender
# of
Songs
Men Songwriters
Women Songwriters
Total
# of
Writers
%
# of
Writers
%
# of
Writers
%
1
1,384
67.3%
218
68.6%
1,602
67.5%
2
294
14.3%
40
12.6%
334
14.1%
3
129
6.3%
19
6%
148
6.2%
4
47
2.3%
10
3.1%
57
2.4%
5
50
2.4%
7
2.2%
57
2.4%
>6
153
7.4%
24
7.5%
177
7.5%
Total
2,057
100%
318
100%
2,375
100%
Note: Range was grouped for presentational purposes with 6 and/or greater credits in one category. Credits
for individual songwriters were determined using songwriters’ names and/or pseudonyms.
For songwriters working the most across the sample, there was a significant difference between men
and women. The men who are credited most on the charts have more songs across 12 years than all but
2 of the most-credited women. In fact, 7 of the 12 men with the highest number of songwriting credits

Annenberg Inclusion Initiative--16
had more total songs on the chart than the highest credited woman. Moreover, the men listed in Table
14 wrote 24.4% of the songs in the entire 12-year sample.
Table 14
Top Individual Songwriters by Gender
Top
Men
# of
Songs
Top
Women
# of
Songs
Drake
52
Nicki Minaj
23
Max Martin
47
Taylor Swift
21
Dr Luke
33
Ariana Grande
17
Benny Blanco
27
Cardi B
16
Cirkut
27
Rihanna
15
Justin Bieber
25
Doja Cat
13
Savan Kotecha
24
Megan Thee Stallion
11
Shellback
22
Selena Gomez
10
Ashley Gorley
22
Adele
10
DJ Mustard
19
SZA
10
JKash
19
Julia Michaels
9
Louis Bell
19
Camila Cabello
9
Katy Perry
9
The number of songs without any women songwriters was also of interest. Table 15 shows the
percentage of songs that included at least one woman songwriter and those that did not across all 12
years sampled. In 2023, 56% of songs included at least one woman songwriter. This is a 12-year high and
a significant increase from 2022 (42%) and 2012 (42%). Overall, 44% of all songs had one or more
women writers credited and 56% completely excluded women. In comparison, less than 1% (0.6%) or 7
songs did not credit a man in a songwriting role.

Annenberg Inclusion Initiative--17
Table 15
Presence vs Absence of Women Songwriters across Sample
Year
0 Women Songwriters
1+ Women Songwriters
2012
58%
42%
2013
62%
38%
2014
60%
40%
2015
52%
48%
2016
47%
53%
2017
59%
41%
2018
59%
41%
2019
53%
47%
2020
65%
35%
2021
53%
47%
2022
58%
42%
2023
44%
56%
Total
56%
44%
Note: Songs that duplicated on the chart from previous years were counted only once.
Each song was examined for the presence of a woman songwriter.
The increase in women songwriters in 2023 is an important step forward for the music industry. While
less than 20% of songwriters were women, the substantial increase for women shows a promising trend
that must continue to hold to reach true change. Notably, the increase is due to the inclusion of women
of color as songwriters. This year, more than half of songs on the Hot 100 Year-End Chart credited at
least one woman in a songwriting role, an important increase from last year. To extend the momentum
toward change, there are two important places to address. First, the top men songwriters were
responsible for almost a quarter of the entire sample. Second, there are still a number of songs that do
not feature any women songwriters. Changing these norms is an important route to ensuring continued
progress for women. In the next section, we review the most exclusionary role for women in music:
producers.
Producers. Producers across the following years were analyzed: 2012, 2015, and 2017-2023.
9
Producing
credits across all songs in these years were examined and every individual receiving a producing credit
was included. Those who earned multiple credits on a song were counted only once for their work
(n=57). There were 217 producers credited on the 2023 Hot 100 Year-End Charts. Of those, 6.5% (n=14)
were women and 93.5% (n=203) were men. In 2023, there was one producer who identified as gender
non-binary (Sam Smith).

Annenberg Inclusion Initiative--18
Table 16
Number and Percentage of Women Producers by Year
Year
% Women Producers
# of Women Producers
2012
2.4%
5
2015
1.8%
4
2017
1.8%
4
2018
2.3%
5
2019
4.9%
11
2020
2%
4
2021
3.9%
9
2022
3.5%
8
2023
6.5%
14
Total
3.2%
64
Note: The percentage of men producers can be found by subtracting the
percentages in each cell from 100%.
Table 16 reveals the percentage of women producers across all years. 2023 (6.5%) marks a new high for
women as producers, surpassing the previous high reached (4.9%) in 2019. However, 2023 was not a
significant increase from 2022 (3.5%), nor was it an increase from 2012 (2.4%). Across 9 years and a total
of 1,972 producing credits, men comprised 96.8% of all producers while women comprised 3.2%. This is
a gender ratio of 29.8 men to every 1 woman producer.
The intersectionality of gender and race/ethnicity was analyzed. Of the 64 women producers across the
sample, 19 or 29.7% were women of color. In 2023, 6 women of color worked as producers. Three of
these women worked as producers on their own songs: Beyonce (Cuff It), Pink Pantheress (Boy's A Liar,
Pt. 2). Mariah Carey appeared for the fourth time as a producer in the sample for her 1994 hit song All I
Want for Christmas is You. The ratio of men producers to underrepresented women producers is 100.4
to 1.
Like songwriters, we were interested in the presence of women producers and analyzed whether each
song featured one or more women producers. Here, we assessed the presence of at least 1 woman
producer per song, rather than as a percentage of all producers. Across all years sampled, 94% of the
831 songs evaluated did not include a single woman producer. In total, only 6% of all songs or 50 songs
included a women producer.
We evaluated how frequently each of the 64 women producers were credited across the sample in
order to better understand the opportunities given to them in popular music. First, we identified the
individual women producers across the study, reducing our total to 34. Under two-thirds (61.8%, n=21)
of the women producers worked only once on a Hot 100 Year-End song across 9 years. Thirteen women
were credited as producers more than once across all years examined. Taylor Swift and Ariana Grande
produced the most songs (8) in the sample. Only 12 of the 34 individual women producers were women
of color. Beyonce and Mariah Carey both had 4 producing credits, the most for women of color across
the sample. Eight of these women produced songs for which they were not also a performer.

Annenberg Inclusion Initiative--19
The data for women producers reveal a continued exclusion in music. In 2023, there were 14 women
credited as producers. Only 6 of these women were from an underrepresented background and 3
underrepresented women were producers on their own songs. Overall, 3.2% of the producers in the 12-
year sample were women, suggesting that career sustainability is not available to many women
producers. In the next section we turn not only to sustainability but notoriety, by examining
nominations for the 2024 Grammy® Awards.
Grammy® Awards: 2013 to 2024
Annually, we conduct an analysis regarding nominees across 6 major Grammy® Award categories:
Record of the Year, Album of the Year, Song of the Year, Best New Artist, and Producer of the Year. This
year, we provide the first update on the Songwriter of the Year category. Across 12 years, individual
nominees were analyzed (members of groups were included as individual nominees).
10
A total of 2,618
individuals were nominated for a Grammy® Award from 2013 to 2024 in these categories.
In 2024, there were a total of 171 nominees; 76% (n=130) were men and 24% (n=41) were women. This
is a ratio of 3.2 men nominated to every 1 woman. Two gender non-binary individuals were nominated
in 2024, and 4 total gender non-binary individuals have been nominated since 2013.
2024 saw a significant increase in the percentage of women nominees, from 15.5% in 2023 to 24% in
2024. This was also significantly higher than 2013 (7.9%), but remains below the highest percentage of
women nominees, which was reached in 2021 (28.1%). Across all years, women represented 14.7% of
nominees across major Grammy® categories.
Table 17
Grammy® Nominations by Gender and Year
Year
Men
Women
2013
92.1% (n=105)
7.9% (n=9)
2014
91.8% (n=156)
8.2% (n=14)
2015
85.9% (n=134)
14.1% (n=22)
2016
88.5% (n=138)
11.5% (n=18)
2017
93.6% (n=190)
6.4% (n=13)
2018
92% (n=92)
8% (n=8)
2019
83.6% (n=138)
16.4% (n=27)
2020
79.5% (n=124)
20.5% (n=32)
2021
71.9% (n=100)
28.1% (n=39)
2022
85.9% (n=486)
14.1% (n=80)
2023
84.5% (n=441)
15.5% (n=81)
2024
76% (n=130)
24% (n=41)
Total
85.3% (n=2,234)
14.7% (n=384)
Note: Table reflects percentage of nominees by gender in 6 categories per year.
A total of 4 gender non-binary nominees appeared across the 12-year sample in
2022 (2) and 2024 (2).

Annenberg Inclusion Initiative--20
The percentage of women nominated per major category across 12 years can be seen in Table 18.
Women were most likely to be nominated for Best New Artist (46.2%) and Song of the Year (29.3%).
However, across 12 years, only 1 woman was nominated for Producer of the Year (1.6%). Women also
received few nominations for Record of the Year (12.2%) or Album of the Year (10.8%). Across 2 years,
women comprised 44.4% of the nominees for the Songwriter of the Year category, introduced in 2023.
Table 18
Grammy® Nominations by Gender and Category
Record of
the Year
Album of
the Year
Song of
the Year
Best New
Artist
Producer
of the Year
Songwriter
of the Year
Total
Men
87.8%
(n=497)
89.2%
(n=1,399)
70.7%
(n=208)
53.8%
(n=63)
98.4%
(n=62)
55.6%
(n=5)
85.3%
(n=2,234)
Women
12.2%
(n=69)
10.8%
(n=170)
29.3%
(n=86)
46.2%
(n=54)
1.6%
(n=1)
44.4%
(n=4)
14.7%
(n=384)
Across 12 years of nominations, Table 19 reveals that 2024 was a significant increase for women across
4 of the 6 categories: Record of the Year, Album of the Year, Song of the Year and Best New Artist. In
the final 2 categories, there has been little opportunity to evaluate change (Songwriter of the Year) or
nominations for women have remained unchanged (Producer of the Year).
Table 19
Women Grammy® Nominations by Category over Time
Year
Record of
the Year
Album of
the Year
Song of the
Year
Best New
Artist
Producer of
the Year
Songwriter
of the Year
2013
11.8%
2%
15.4%
16.7%
0
-
2014
2.8%
6.5%
31.2%
16.7%
0
-
2015
18.8%
8.2%
27.3%
50%
0
-
2016
6.7.%
8.1%
33.3%
60%
0
-
2017
7.5%
4.4%
14.3%
33.3%
0
-
2018
0
6.1%
12%
60%
0
-
2019
9.1%
13.3%
18.9%
58.3%
20%
-
2020
8.5%
17.3%
44.4%
46.2%
0
-
2021
23.7%
18.6%
44.8%
75%
0
-
2022
14.3%
11.4%
32.6%
38.5%
0
-
2023
15.1%
12.5%
27%
50%
0
60%
2024
23.1%
18.5%
38.1%
55.6%
0
20%
Note: Cells contain the percentage of women nominated per category. To obtain the percentage
of men nominated, subtract the cell percentage from 100%.
When looking at the intersectionality of gender and race/ethnicity across 12 years, 52.6% (n=202) of
women nominees were white and 47.4% (n=182) were from an underrepresented racial/ethnic group.
Table 20 contains the percentage of nominations for white and underrepresented women by year.
Compared to 2023 (61.7%) and 2022 (58.8%), there was a decrease in nominations for women of color

Annenberg Inclusion Initiative--21
in 2024 (36.6%). 2024 was on par with 2013 (33.3%) in terms of the percentage of nominations for
women of color.
Table 20
Women Grammy® Nominations by Underrepresented Status and Year
Year
White Women
UR Women
2013
66.7% (n=6)
33.3% (n=3)
2014
85.7% (n=12)
14.3% (n=2)
2015
77.3% (n=17)
22.7% (n=5)
2016
72.2% (n=13)
27.8% (n=5)
2017
38.5% (n=5)
61.5% (n=8)
2018
50% (n=4)
50% (n=4)
2019
48.1% (n=13)
51.9% (n=14)
2020
56.2% (n=18)
43.8% (n=14)
2021
61.5% (n=24)
38.5% (n=15)
2022
41.2% (n=33)
58.8% (n=47)
2023
38.3% (n=31)
61.7% (n=50)
2024
63.4% (n=26)
36.6% (n=15)
Total
52.6% (n=202)
47.4% (n=182)
Nominations by category for white and underrepresented women appear in Table 21. Women of color
were more likely to be nominated for Album of the Year (55.3%) and Best New Artist (51.9%) than
Record of the Year (42%) or Song of the Year (33.7%).
Table 21
Women Grammy® Nominations by Underrepresented Status and Category
Record of
the Year
Album of
the Year
Song of
the Year
Best New
Artist
Producer
of the Year
Songwriter
of the Year
Total
UR
42%
(n=29)
55.3%
(n=94)
33.7%
(n=29)
51.9%
(n=28)
100%
(n=1)
25%
(n=1)
47.4%
(n=182)
White
58%
(n=40)
44.7%
(n=76)
66.3%
(n=57)
48.1%
(n=26)
0
75%
(n=3)
52.6%
(n=202)
The frequency of nominations by gender over the 12-year sample was of interest. Here, we identified
the individuals nominated for a Grammy Award in the categories of interest across the sample and
tallied how many times each person was nominated. This reduced our sample to 1,388 individual
nominees. Of these, 85.7% (n=1,189) were men and 14.3% (n=199) were women. In other words, 6 men
were nominated for every 1 woman. There we 3 nominees identified as gender non-binary over the 12-
year sample. See Table 22.
There were few gender differences in the number of nominations. Men and women were as likely to be
nominated once as they were at 5 or more nominations. Among men and women with the most
nominations, there were deviations, however. The most frequently nominated man received twice as
many nominations (Serban Ghenea, 31) as the most frequently nominated women (Taylor Swift, 15).

Annenberg Inclusion Initiative--22
Table 22
Number of Grammy® Nominations by Gender
No. of Nominations
Men
Women
1
67.8% (n=806)
64.3% (n=128)
2
15.9% (n=189)
17.6% (n=35)
3
7.1% (n=85)
7.5% (n=15)
4
2.7% (n=32)
3% (n=6)
≥5
6.5% (n=77)
7.5% (n=15)
Total
1,189
199
The frequency of nominations for women by race/ethnicity was also evaluated, as shown in Table 23.
Across 12 years, 199 individual women were nominees. More than half (51.2%, n=102) were
underrepresented and 48.7% (n=97) were white. Women from an underrepresented background were
more likely than their white counterparts to receive a single nomination while white women were more
likely to receive 3 nominations.
Overall, 31.4% of underrepresented women were nominated two or more times, compared to 40.2% of
white women. Taylor Swift was the most nominated women across all years (15). Beyonce and H.E.R
tied with 10 nominations each and were the highest nominated women from an underrepresented
background.
Table 23
Frequency of Nominations for Women by Race/Ethnicity
No. of Nominations
UR Women
White Women
1
68.6% (n=70)
59.8% (n=58)
2
16.7% (n=17)
18.6% (n=18)
3
4.9% (n=5)
10.3% (n=10)
4
3.9% (n=4)
2.1% (n=2)
≥5
5.9% (n=6)
9.3% (n=9)
Total
102
97
The Grammy® nominations in 2024 reflect much-needed progress for women after two years of decline.
In 2024, women comprised nearly one-quarter of the nominees across 6 major categories. This includes
significant increases across four categories: Record of the Year, Album of the Year, Song of the Year, and
Best New Artist. While the majority of nominations went the white women in 2024, there is encouraging
progress for women at the highest level of recognition in the music industry.
Conclusion
Every year, the purpose of this report is to examine the gender and race/ethnicity of artists, songwriters
and producers whose work is featured on the Billboard Hot 100 Year-End Chart. Spanning 2012 to 2023,
this investigation covered 12 years and 1,200 songs. Additionally, 12 years of Grammy® nominations in
major categories were evaluated. In this section, we review the major trends illuminated by the study
and offer solutions to create change.

Annenberg Inclusion Initiative--23
Women in Music Finally Ascend the Charts
In 2023, the percentage of women artists on the popular charts reached an all-time high of 35%. This is a
milestone, and signals two consecutive years of consistent progress for women artists. Notably, the
progress for women was primarily for women working as individual artists. Women in groups (e.g., duos
and bands) rarely appeared on the popular charts.
The gains for women artists are mirrored behind the scenes, as this was the first year that women
songwriters have seen significant change in 12 years. Although the figure is still less than one-fifth of
songwriters on the popular charts, the 19.5% of songwriters who are women represent a key step
forward for the industry as a whole. Additionally, 2023 was 1 of only 2 years when more than half of
songs on the Billboard Year-End Chart had at least one-woman songwriter.
Even among producers there were signs of some progress. While no significant increases were observed,
2023 was the high point for women across the 9 years evaluated. Women still filled fewer than 10% of
all producing roles and worked on fewer than 10% of all songs, but the 6.5% of producers in 2023 (and
the 14 women this represents) demonstrate to the industry that there are women who can and want to
fill these roles. Moreover, it shows that women can be hitmakers, too.
Women of Color are Creating Change
Women of color were the driving force behind the changes for artists and songwriters. Sixty-five percent
of women artists were from an underrepresented racial/ethnic background. Among songwriters, the
work of women of color was responsible for the first-ever gains observed in this position. Fifty-five
women of color were credited as songwriters in 2023—a 12-year high. Finally, nearly half of the women
producers on the Hot 100 Year-End Chart in 2023 were women of color.
These findings reflect two important things. First, the audience for work by women of color exists and is
eager to consume content created by these women. Too often, women of color are excluded from
opportunities to create high-profile and high-impact content due to biases around the commerciality of
their work and myths about what audiences want. Second, the industry at large seems to have taken
note of this and is supporting—at least in some measure—the work of women of color. This is a
promising development and bodes well for a future in which the music industry is one in which women
of color can thrive.
Grammy® Nominations Show Progress For Women
After two years of decline, there was an increase in women nominees in major categories at the 2024
Grammy® Awards. This is an important finding, as it demonstrates that the members of the Recording
Academy can and will recognize outstanding work by women. Across 4 of the 6 categories evaluated,
nominations for women increased.
Despite these gains, there are still places where progress is needed. Although women of color were
responsible for change on the charts, nominations for women of color declined this year. Women of
color were also more likely than white women to be nominated only once across the 12-year sample.
The lack of recognition for women of color in 2024 is a bit of an anomaly given that in other years

Annenberg Inclusion Initiative--24
women of color received the majority of nominations. While this may be an outlier year for the
nominations, it is important to ensure that this one-year dip does not become a trend.
Solutions for Change
The findings in this year’s report reveal several promising trends for women in the music industry, but
key disparities still exist. How can the industry harness the momentum that it currently has and continue
or even accelerate change for women across the music business? With each report, we offer solutions
for change. We describe these below.
One Song, One Opportunity. As noted above, 2023 was 1 of only 2 years when more than half of songs
on the Billboard Hot 100 Year-End Charts featured at least one-woman songwriter. Yet, even in 2023
44% of songs still did not have even one woman credited in this role. More than 90% were missing
women producers. Each song represents an opportunity to change the numbers for women across these
positions, if only decision-makers and gatekeepers are thoughtful about the process. By considering who
is in the room, who gets credit for their work, and who is part of the teams creating songs, it is possible
to create more opportunities for women to participate in this creative work. This is even more
important when the songs in question are likely to be among the most popular each year. By viewing
each song as a chance to create change, the music industry can move the needle more quickly than it
has in the past.
Continue to Support Programs that Advance Women. The numbers in this report demonstrate that there
are women available across the music industry for creative collaboration. However, to ensure this
remains the case, supporting the programs that have been part of accelerating change is necessary.
Efforts such as We are Moving the Needle, Femme House, Girls Make Beats, She Is The Music, the
Spotify Equal Program, Women’s Audio Mission, Keychange, Be The Change, and others have been and
continue to support girls, women, and non-binary people as they gain experience and expertise across
different aspects of music. The music industry must strengthen the bridges built between these groups
and the studios and stages where women remain excluded. This goes beyond donating money to these
endeavors and includes interviewing, hiring, and collaborating with women participating in support
programs. When programs lead to professional opportunities, both individuals and industry win.
Eliminate Impediments to Career Progress. In previous reports, we have described the underlying
reasons for women’s exclusion in music.
11
These include persistent stereotyping of women’s creative
output (e.g., pigeonholing them into specific genres) or the roles they can hold. Women must also
navigate an industry that routinely sexualizes them and doubts their talent and experience. To remove
these barriers facing women, the industry as a whole must engage in collective action. This means that
the programs mentioned above must work in concert with individual efforts within labels, publishers,
and live music companies (and other industry groups) to address the impediments facing women.
Improving the industry for women requires that people from all backgrounds serve as allies and
champions to ensure that access and opportunity are available to all.
We still hear far too often that women “have to be really good” to write with top talent. Sadly, the
standards of “quality” apply differently to males and females in the entertainment industry. We have so
much data to back up this claim. What truly needs to change is the perceptions of gatekeepers who
prevent women songwriters and producers from working with women artists, as a first step. Artists also
need to know about the numbers in reports like these to understand how they might be unconsciously
or consciously perpetuating the status quo. The audience, particularly Gen Z, values authenticity. Male

Annenberg Inclusion Initiative--25
songwriters penning songs performed by women artists flies in the face of what this generation wants
and engages with.
Limitations
This annual report does have a few limitations. First, the study focuses on the Billboard Hot 100 Year-
End Chart, a metric that offers insight into the songs that were the most popular each year. Examining
the percentage of women working on less popular music/songs would provide different insights into the
opportunities available to women in the industry. The choice to focus on popularity is one that offers a
look at how often women get to participate in the most lucrative areas of the industry and where the
strongest impediments to progress might exist. We have heard your complaints about focusing on the
top charts. But given our desire to create career sustainability and generational wealth for historically
marginalized communities in music, this is the arena—the top of the charts—that must change.
Second, it is important to continue to investigate how racial/ethnic identification might play a role in the
opportunities for artists, songwriters, and producers. While our work focuses on all underrepresented
individuals, examining the participation of people from specific racial/ethnic backgrounds is also an
important element for future research to tackle.
This year’s report offers hope that the opportunities for women in music can and will change. What
comes next is a crucial test of the industry—can the music business maintain this level of participation
for women, and can it continue to improve? The answer to this question has consequences for not only
this generation of artists, songwriters, and producers, but for those to come.

Annenberg Inclusion Initiative--26
Footnotes
1. We collected the complete list of Billboard’s Hot 100 Year-End Chart from
https://www.billboard.com/charts/year-end/hot-100-songs/. Year to year, songs repeat. We include
these when analyzing yearly trends. These songs are removed from the analyses related to credits for
individual artists and songwriters to avoid counting duplicating credits. Across the 12-year sample there
were 122 songs that were repeated.
The original report by S. Smith, M. Choueiti, K. Pieper, and others (2018) contains details on the approach
to unitizing and variable definitions (http://bit.ly/2GhiUgj). Information on song artists came from the
Billboard website. Gender was identified via online information (databases, interviews, pronoun usage,
etc.).
2. The 2024 Grammy® nominations were taken from: https://www.grammy.com/news/2024-grammys-
nominations-full-winners-nominees-list. These individuals were entered into our combined data file that
spanned 2013-2023. The Producer of the Year designation refers to nominations in the Producer of the
Year, Non-Classical category. The Recording Academy added the Songwriter of the Year category in 2023,
and it appears once again in this year’s analysis.
3. U.S. Census Bureau (n.d.). Quick Facts. Retrieved January 25, 2023 from:
https://www.census.gov/quickfacts/fact/table/US/PST045221.
4. Initially, 14 songs in 2024 were affiliated with genres that were not included in the study parameters.
Those genres were: Latin, Pop Latino, Singer/Songwriter, Afrobeats, Holiday, K-pop and Musica Mexicana.
We collapsed individual songs into the categories of Hip-Hop/Rap and Pop where possible. However, 5
songs could not be classified into any existing genres and were excluded from analysis.
5. The Billboard chart provided information on artist credits. Each artist had their own individual line of data.
Those credited as “featuring” were considered to be featuring artists, while "&,” “with,” “and,” or “X”
were considered to be individual artists. The only exception was when the two artists credited in this
manner performed as a duo consistently. The current members of each band or duo were investigated
and included—each member received an independent line of data. In the full 12-year sample, there was
one band that had fewer than 3 members (Panic! At the Disco). Based on the approach to crediting, this
was still considered to be a band. In 2022, one soundtrack credited “cast” which could not be identified
and was not included in the analysis.
6. The race/ethnicity of every artist was evaluated. Our approach to this process is detailed in our original
report.
7. U.S. Census (n.d.)
8. Using three repertories (ASCAP, https://www.ascap.com/repertory); BMI,
http://repertoire.bmi.com/StartPage.aspx; and SESAC, https://www.sesac.com/#!/repertory/search) we
identified songwriters associated with songs on the Billboard Hot 100 Year-End Chart of 2023. Two songs
did not appear in these databases. For these songs, credits were taken from album booklets or other
online sources (Genius, Spotify). One song in 2023 did not have producer information. To determine the
gender and race/ethnicity of songwriters and producers, information about each person was found from
online sources. Senior research team members judged the race/ethnicity of any individual for whom
information was not available. There were no individuals whose gender could not be ascertained, and no
women songwriters whose race/ethnicity was inferred.

Annenberg Inclusion Initiative--27
9. Producers for each song were identified using liner notes as well as information from online sources (e.g.,
Genius, Spotify). Producer credits were those that met Recording Academy guidelines and included
producers, co-producers, and vocal producers. Producers were only counted once per song, even if they
received multiple producing credits. The gender of 1 producer in the 11-year sample was not able to be
ascertained. The race/ethnicity for all women producers was available via online sources for 2023. One
group of producers could not be identified and was excluded. Across the 2023 sample, there were 2
songwriters whose race/ethnicity could not be confirmed The race/ethnicity of 1 Producer was inferred.
All of these individuals were men.
10. Upon release of the Grammy® nominations, the list of nominees was collected from
https://www.grammy.com/news/2024-grammys-nominations-full-winners-nominees-list. Every individual
nominated, including individual members of bands and duos, received a line of data in the analysis. There
were a few exceptions to this. In 2022, 3 groups had members who could not be identified and were
excluded from analysis. Each received a single featuring artist nomination as a group for the Record of the
Year category in 2022.
Data on Grammy® nominations for 2022 have been updated from our previous report. The original
numbers and percentages reported mistakenly excluded repeat nominations across categories. Those
numbers and percentages have been changed to reflect all nominations for a person across category.
11. Smith, S.L., Pieper, K., Choueiti, M., Clark, H., Case, A., & Villanueva, S. (2019) Gender and Race/Ethnicity
of Artists, Songwriters & Producers across 900 Popular Songs from 2012-2018. Annenberg Inclusion
Initiative. http://assets.uscannenberg.org/docs/aii-inclusion-recording-studio-2019.pdf

Annenberg Inclusion Initiative--28
Acknowledgements
This is the seventh report on inclusion in popular music and would not be possible without the support
of several people. Thank you to Spotify for their ongoing sponsorship of the study, and to Kristin Jarrett,
Madeleine Bennet, Sulinna Ong, and Anthony Langone as well as the broader Spotify team for their
assistance. Others across the industry have been allies of this work from the beginning, and we are
grateful for their ongoing partnership.
Our wonderful team at the Annenberg Inclusion Initiative also merits mention: Ariana Case, Al-Baab
Khan, Brooke Kong, Bryan Davis, Katherine Neff, Zoe Moore, Zoily Mercado, Ashley Kolaya, Sarah Neff,
and W. Michael Sayers have all been supporters and champions of this work. At the core of our efforts
are a team of students who make every study possible. Thank you to Hrushikesh Lavate, Neeharika
Goyal, Habeeba Kamel, Danielle Hsieh, A.J. Domingo, Cierra Morgan, Elva Liu, Jaden Sibrian and Anish
Lahorani for their contributions to the data collection.
